How to inspect elements with Chrome Developer Tools and in other browsers
The inspect elements feature of a web browser is one of the basic tools when working with websites and web apps. It is part of the Chrome Developer Tools packet.
What are (Chrome) developer tools?
The “inspect elements” feature is one of the tools included in the web development tools in the browser. Known as “developer tools” in the Chrome browser, the more common name “Chrome DevTools” has become popular. Chrome Developer Tools is the result of a long development process, starting with “Firebug” in Firefox and “Web Inspector” in Webkit (Safari) around 2006.
“Inspect element” is, therefore, not a feature on its own, but rather serves as an entry point to Chrome DevTools. Chrome Developer Tools is a collection of essential tools to be used when working with websites. Chrome DevTools is used in the areas of design, development, analysis and optimization. Other browsers have a similar feature:
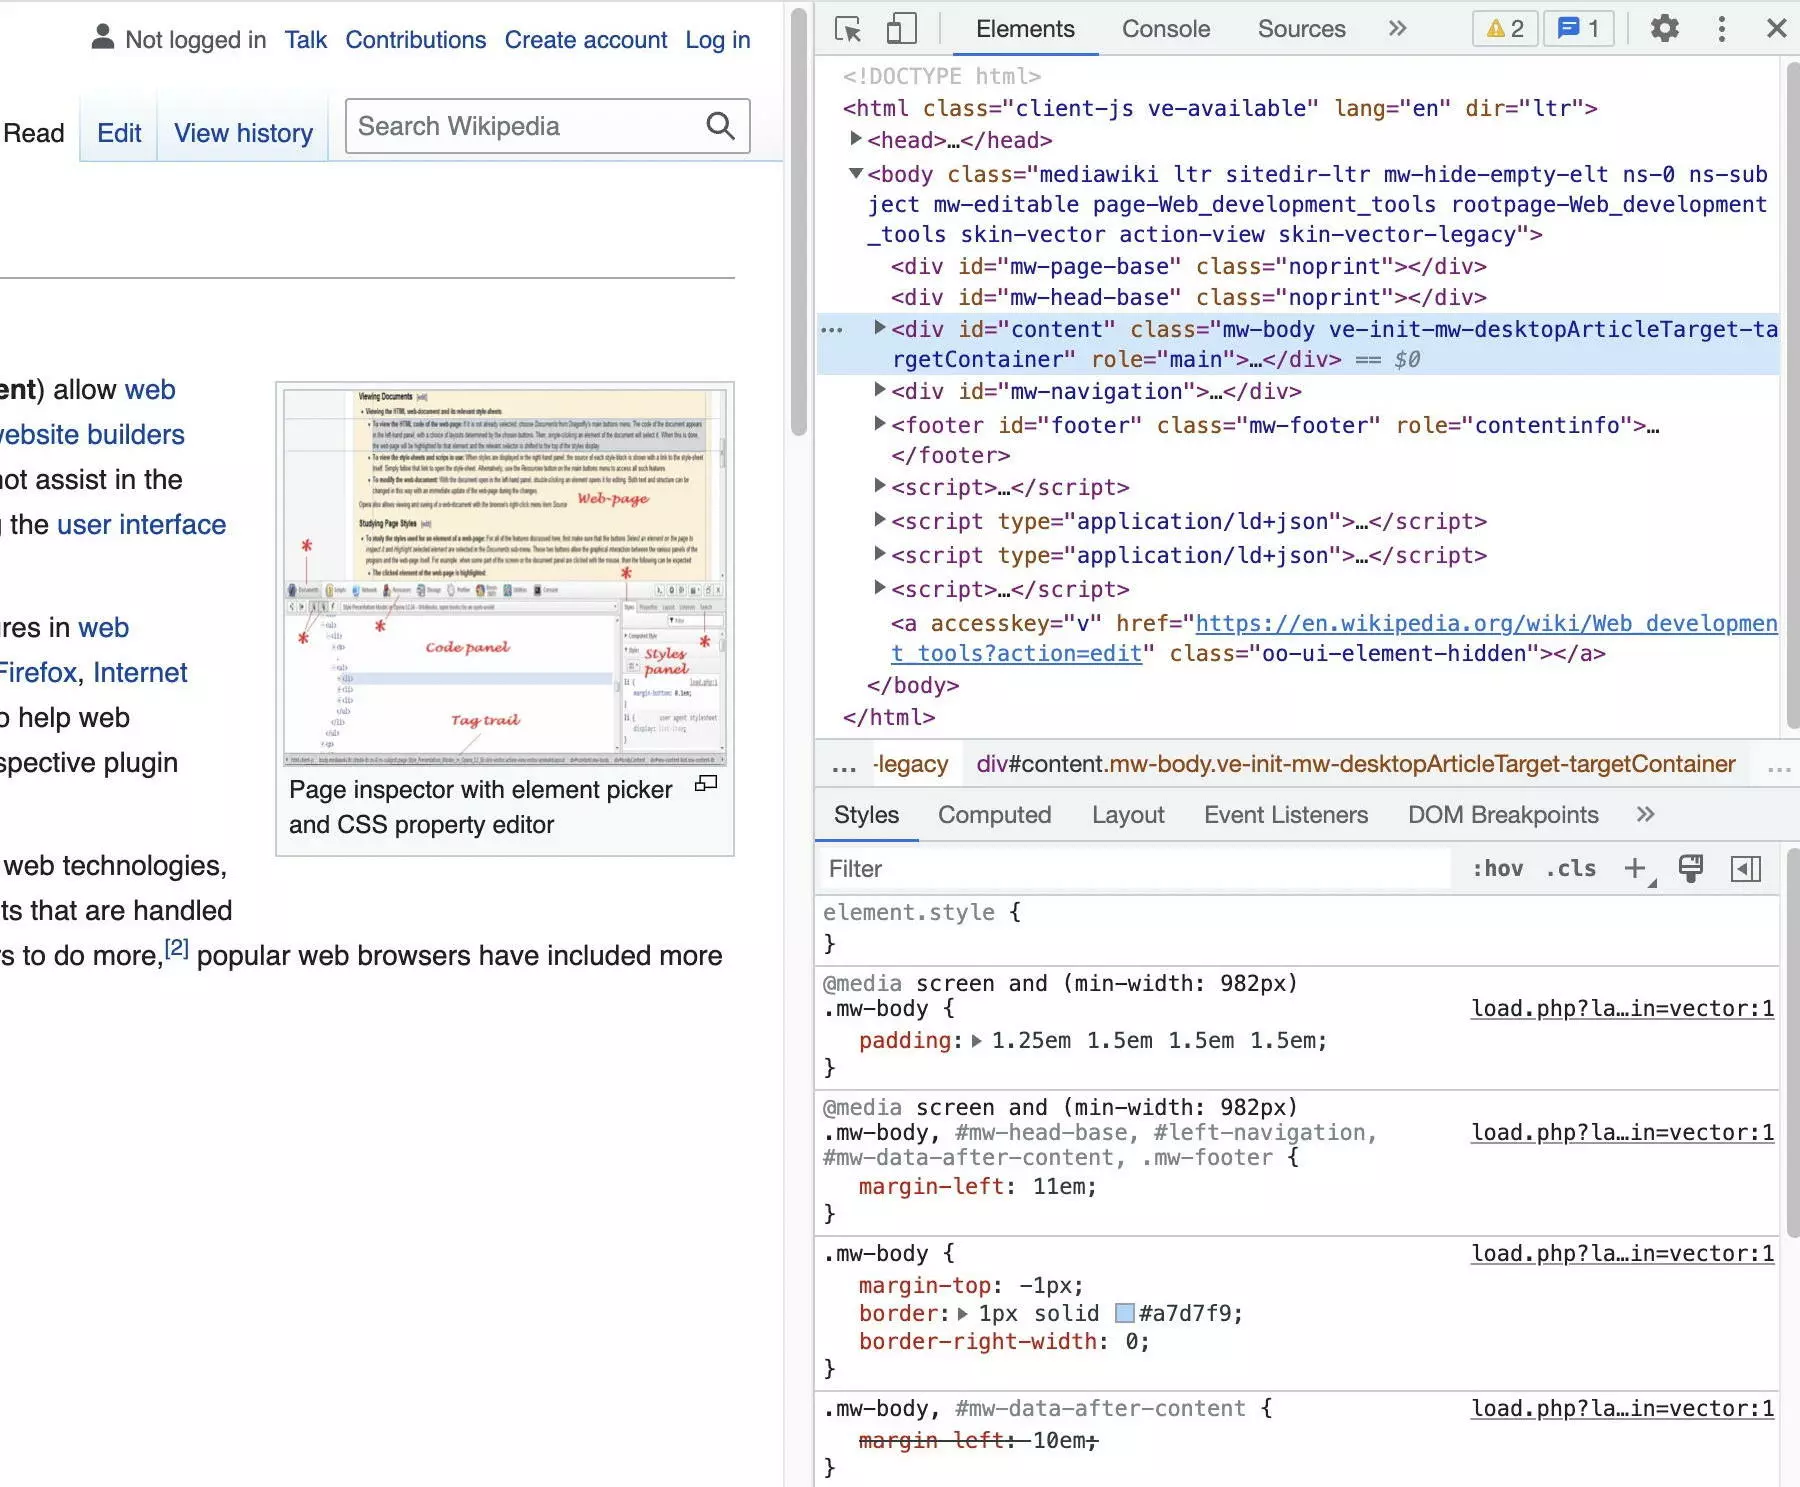
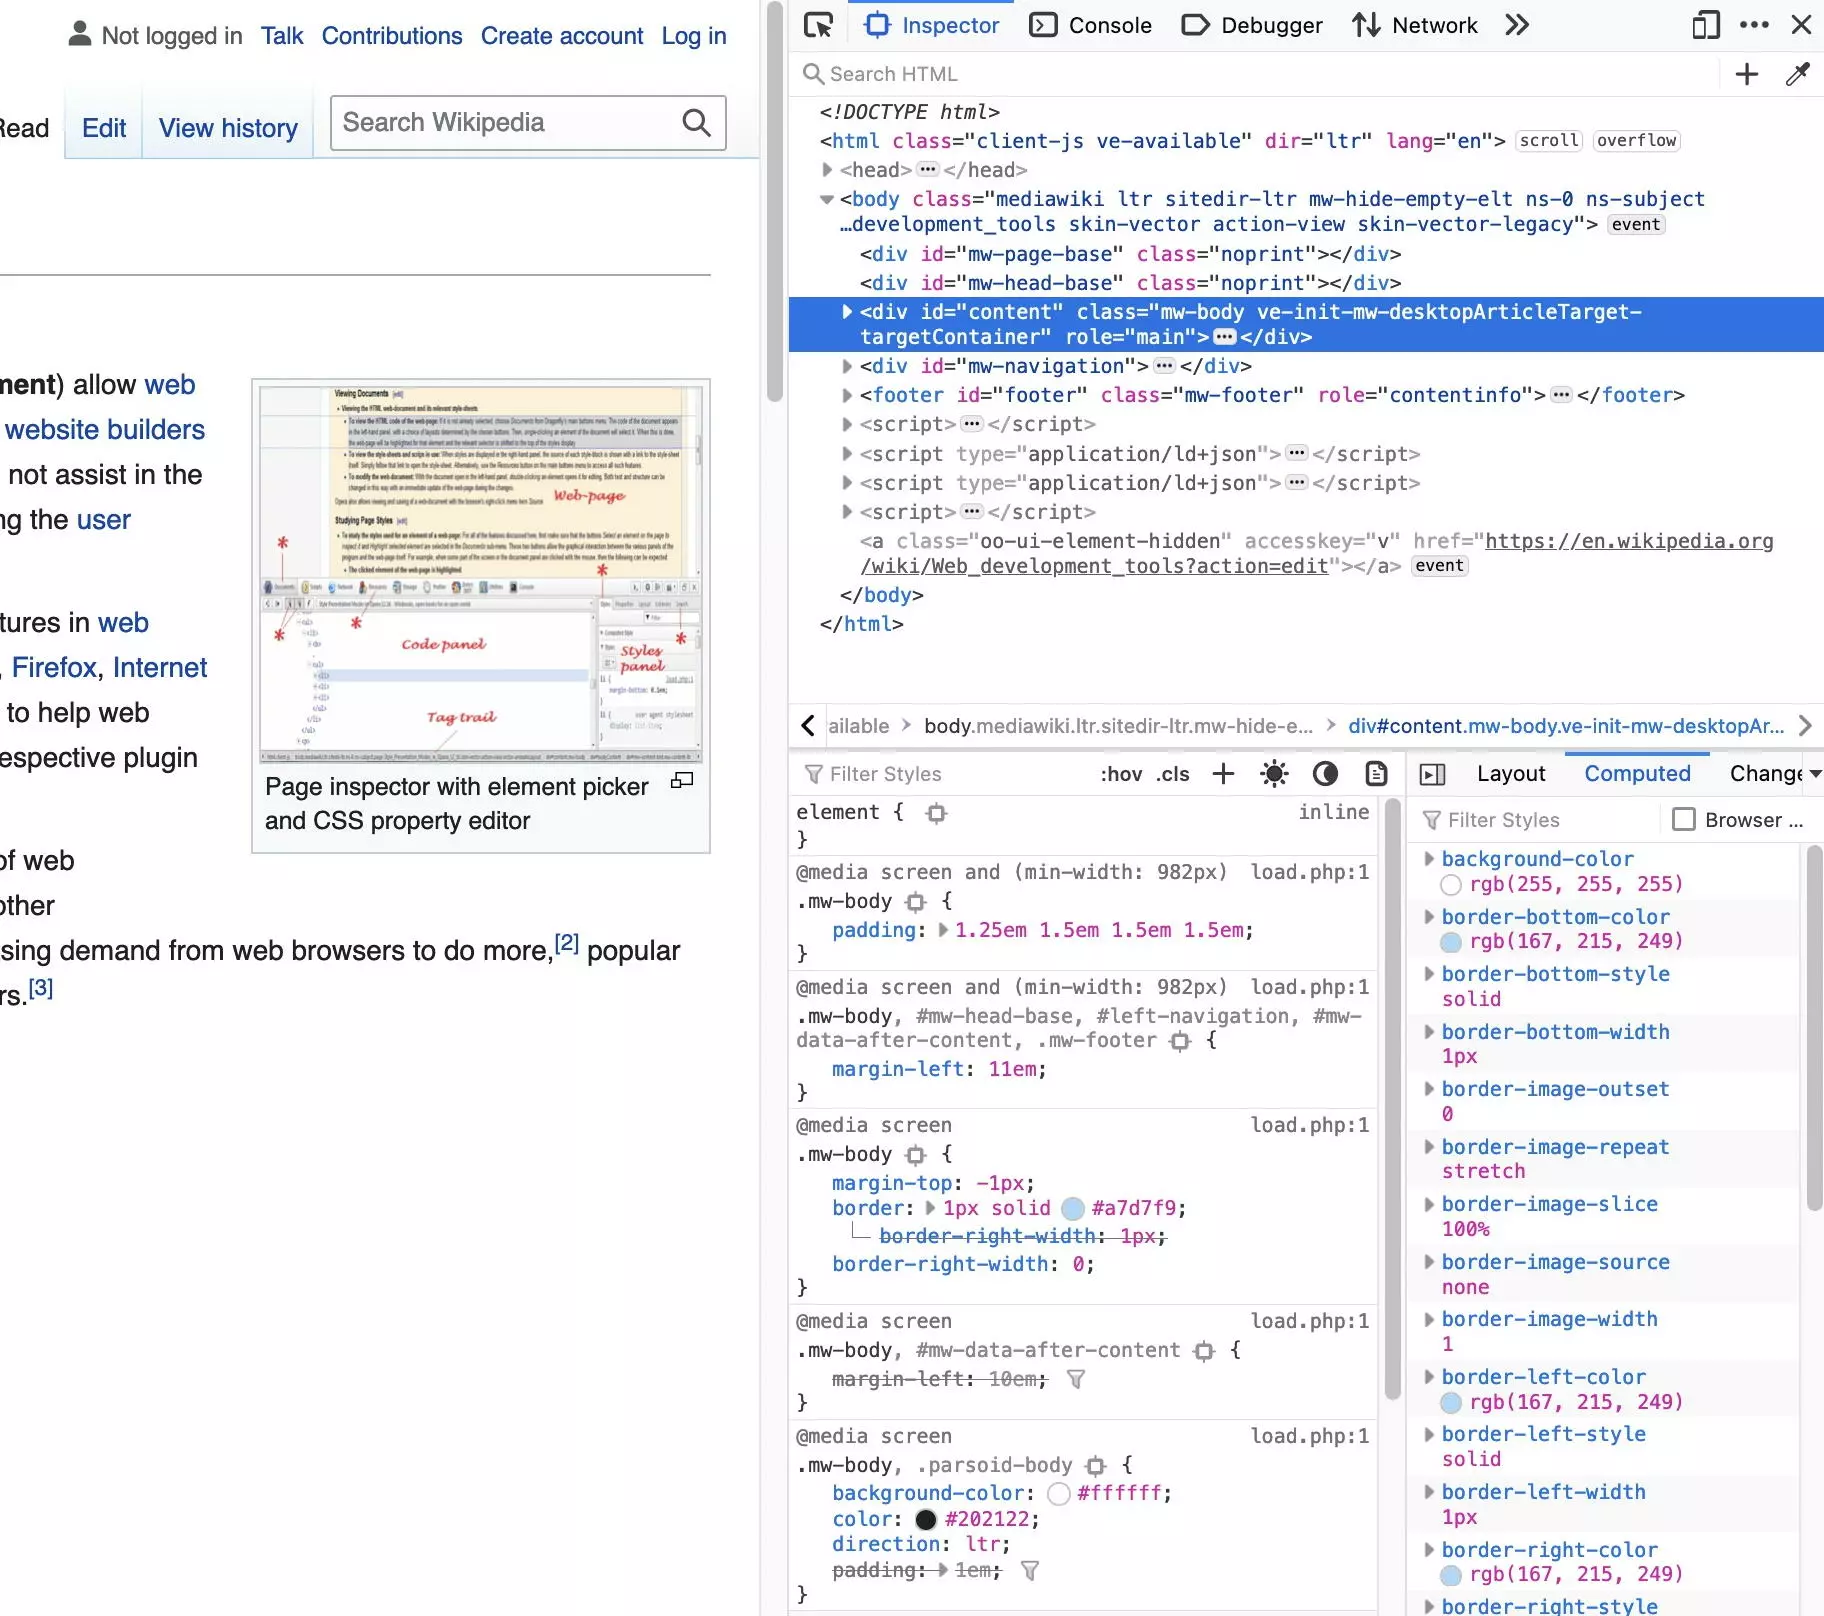
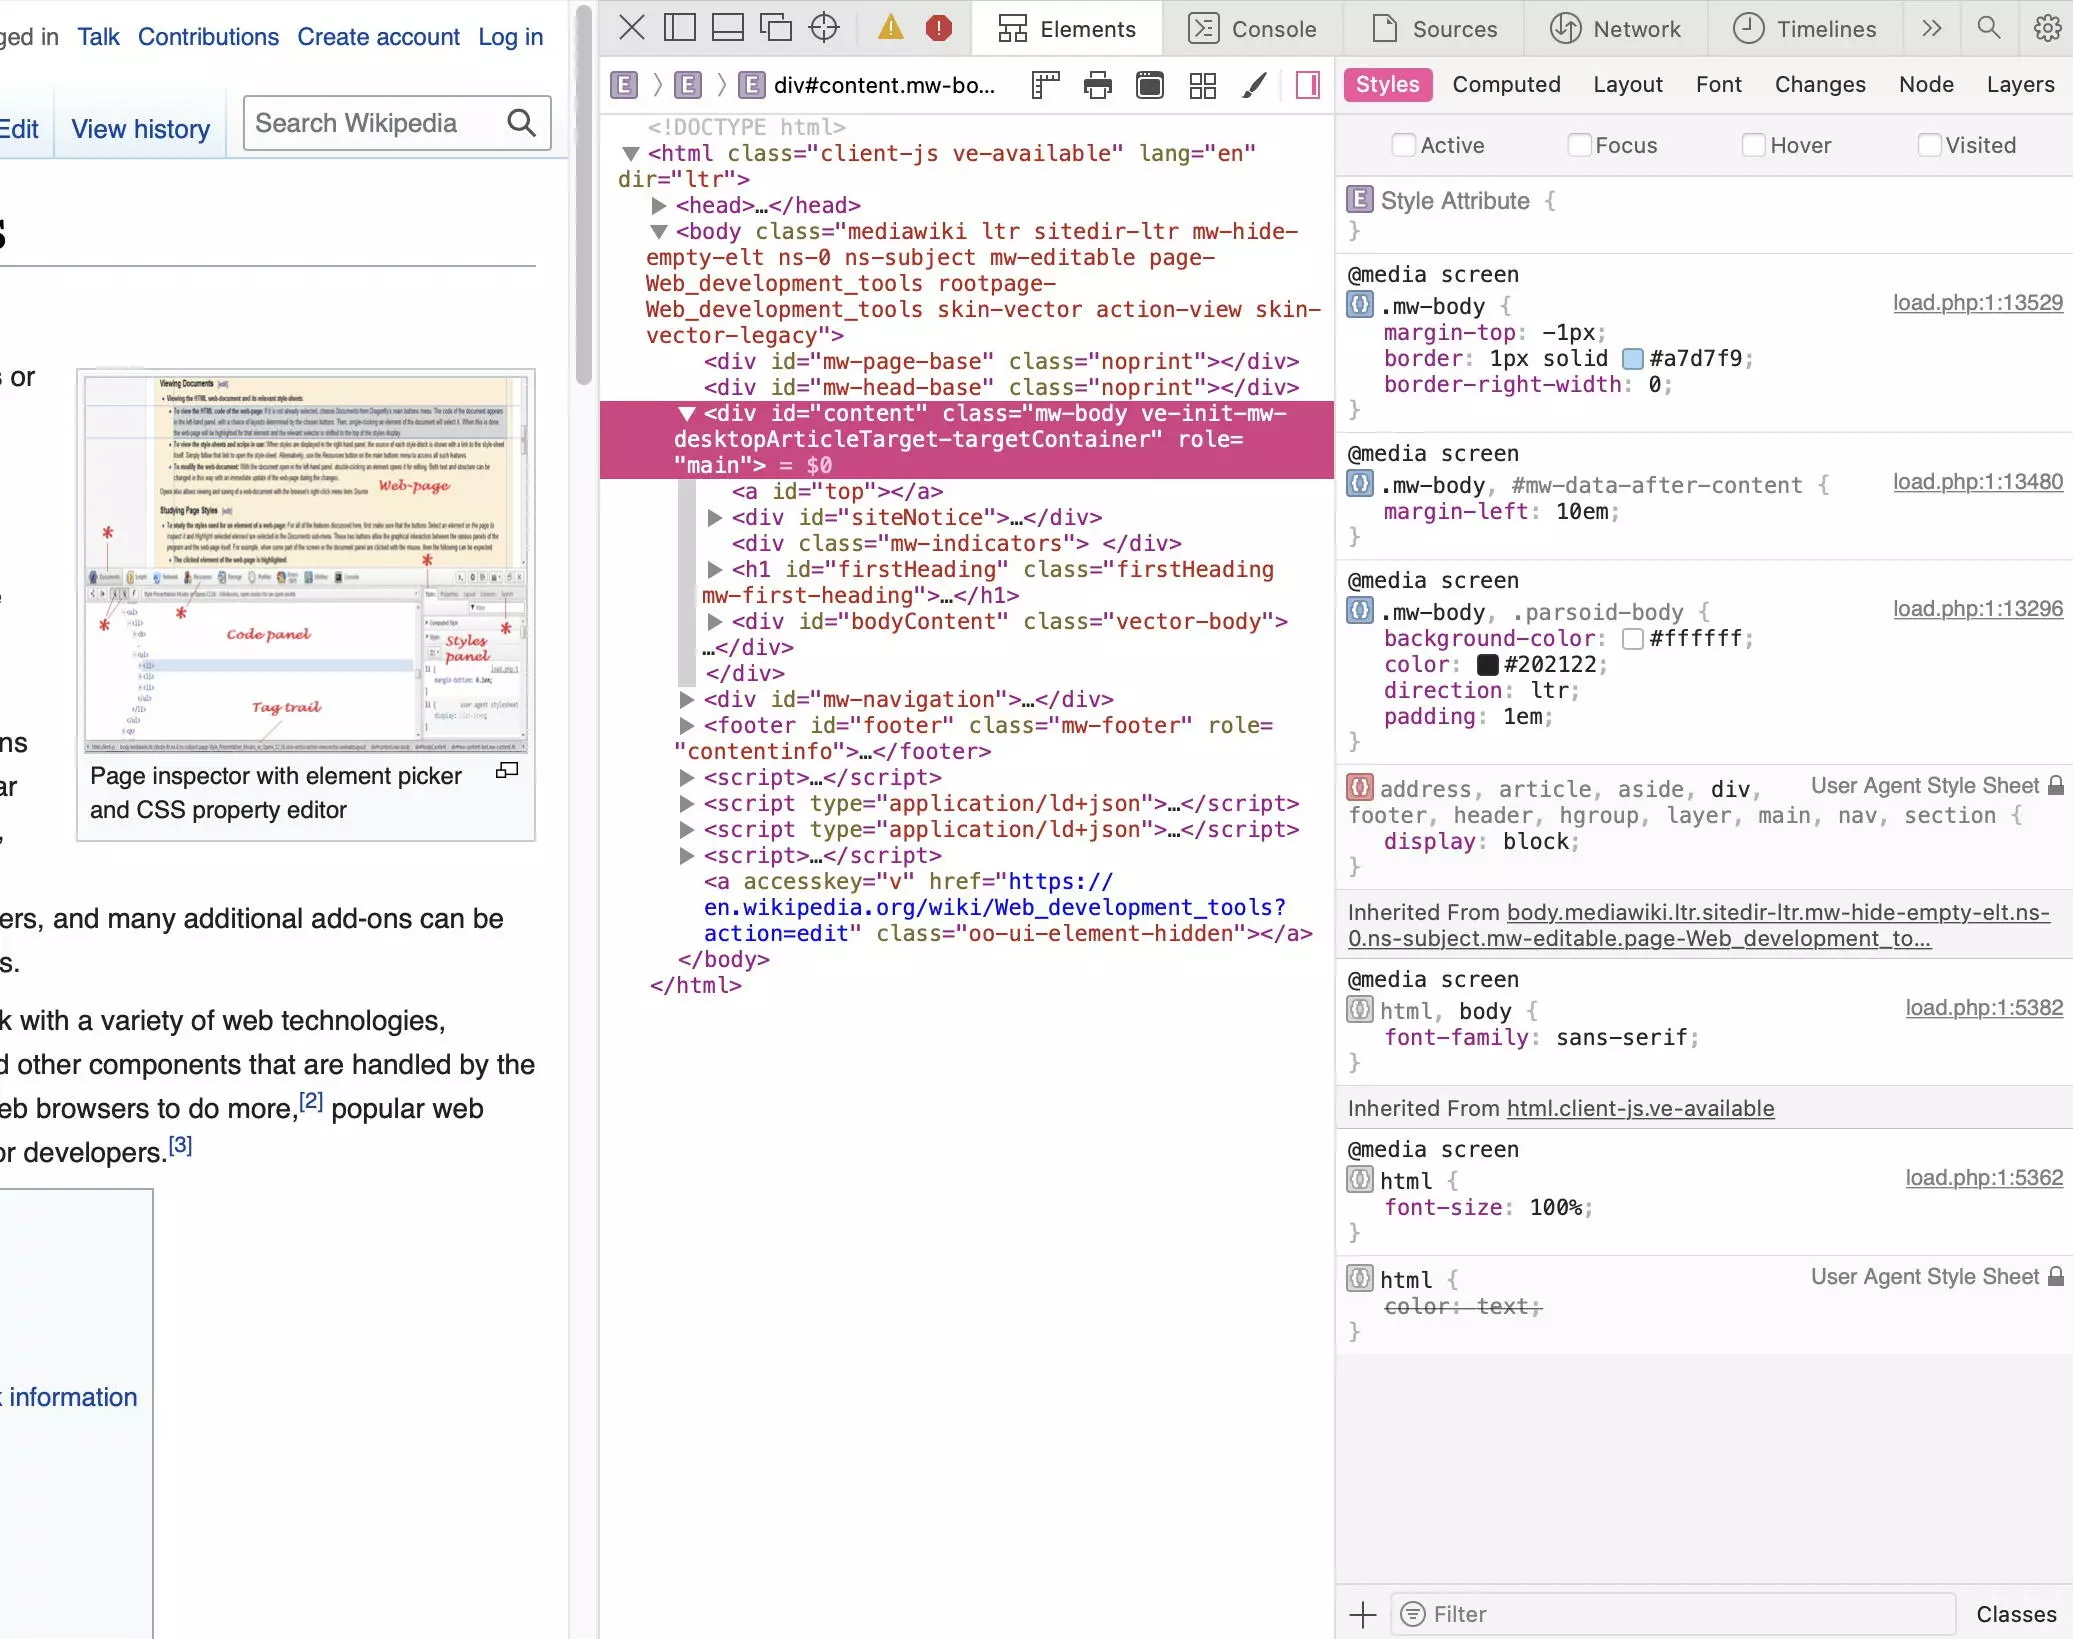
The examples we’ve used are from the website “https://en.wikipedia.org/wiki/Web_development_tools”.
A website uses a HTML document as its basic framework. Contained within it is the content, mostly text and images, as well as other resources such as stylesheets, scripts and fonts. All of a website’s information is then put together as a visual element by the browser.
Reproducing the links between the elements of a website traditionally required an analysis of the HTML document and the source code of other resources. The large scope of CSS and JavaScript on modern websites makes this practically impossible nowadays. This is where Chrome Developer Tools comes in. DevTools allows you to take a look behind the scenes and inspect several aspects of a website:
| Web aspect | Medium/language |
|---|---|
| Content | Text, images, multimedia, etc. |
| Structure | HTML |
| Presentation | CSS |
| Behaviour | JavaScript |
the (Chrome) DevTools feature “Inspect element” in the browser explained
A browser opens a HTML document from a server and displays it. HTML defines the structure of the document, which elements there are and how these are nested into one another. The document is stored on the server in the form of source code. However, this source code is just the framework.
The browser then builds on this, creating the Document Object Model (DOM). If you were to only look at the source code, you wouldn’t have all the information, or, in more concrete terms, the information wouldn’t be readily visible. The HTML structure of the individual elements can be reproduced using markdown editors.
Would you like to do more with HTML and CSS? Here are some articles to get you started:
What are the benefits of (Chrome) DevTools?
To get a better understanding of the benefits of “inspect element”, it’s helpful to compare it to the older feature “show source code”. This feature is still available and useful, albeit in a limited way. With ‘show source code’ users can open the source code of a HTML document in their browser. This, however, only displays a small sample of the information present on a website. For example, dynamic elements which have been placed on the website by JavaScript will not be shown.
Only by using “inspect element” or the Chrome DevTools will all DOM elements be shown. It doesn’t matter if they are generated statically in HTML or dynamically with JavaScript. Furthermore, the actual structure of the elements as well as classes and Ids will be displayed. Chrome Developer Tools allows users to manipulate elements and see the effects of such changes immediately.
| Show source code | Inspect element | |
|---|---|---|
| Display of | source code | DOM |
| Elements | only static | static and dynamic |
| Make changes | change source code | manipulate elements |
| Show changes | reload page | immediately shown |
Chrome Developer Tools includes all parts of a website and shows the chronological order of when resources have been opened. It also tracks joining processes and performance. Additionally, local storage and website data collected by cookies can be evaluated by Chrome DevTools as well.
How to access Chrome Developer Tools
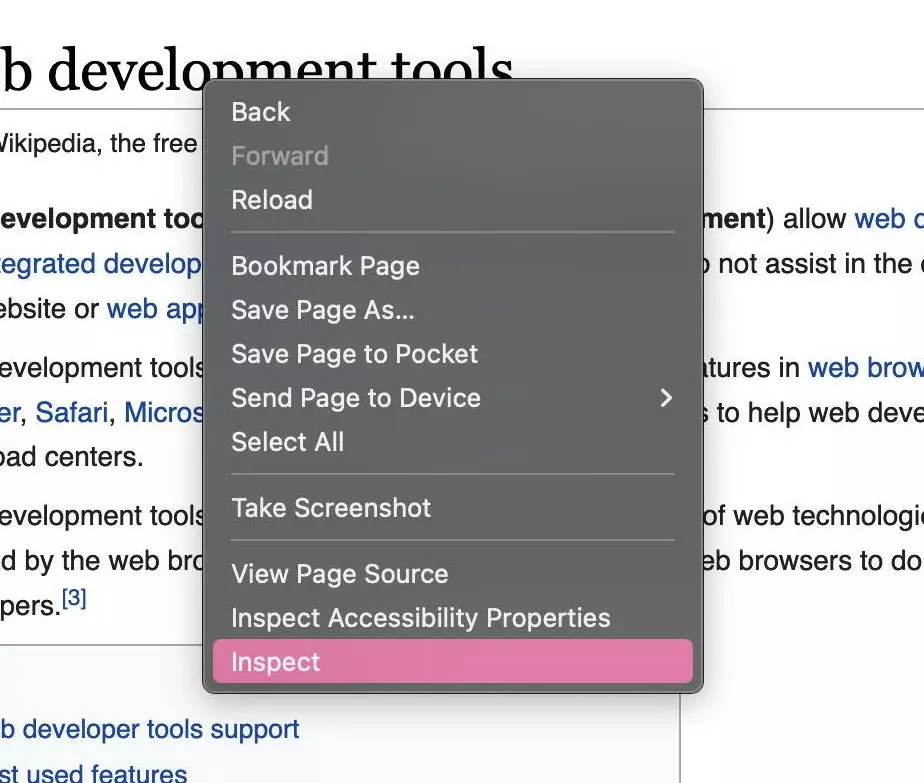
The actual “inspect element” feature depends on the context. To carry it out, right-click on an element and then choose “inspect element” from the context menu displayed. Here it is shown in Chrome and Firefox:
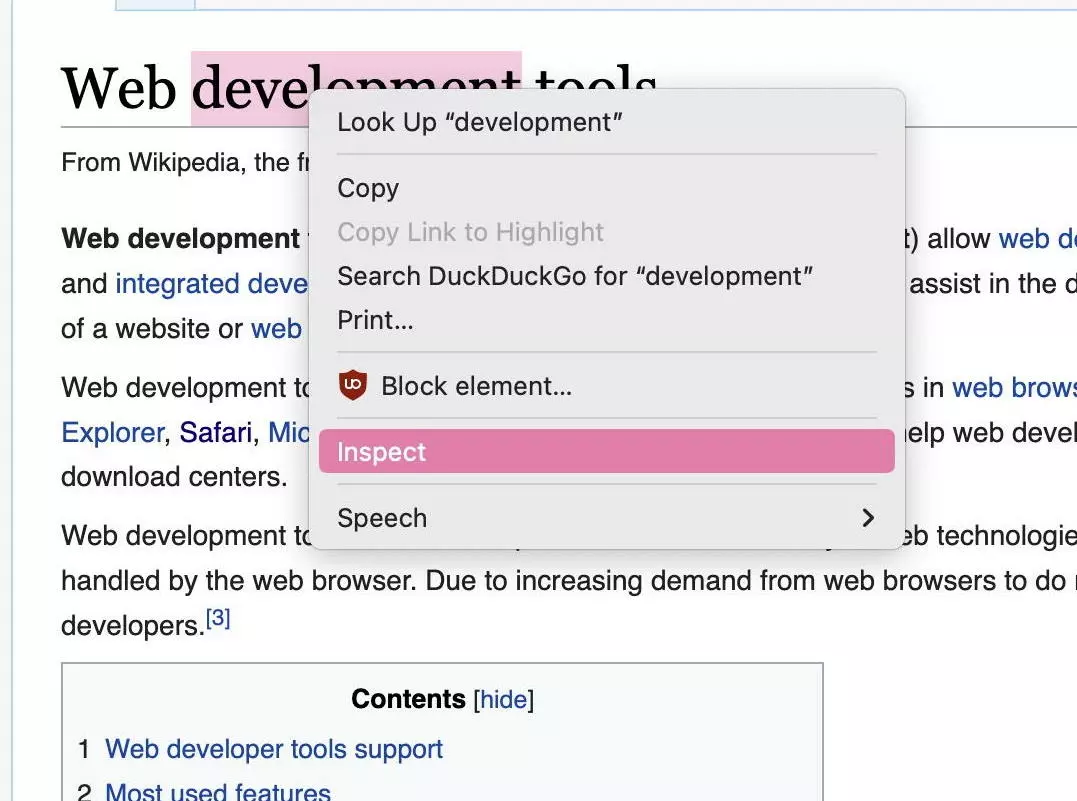
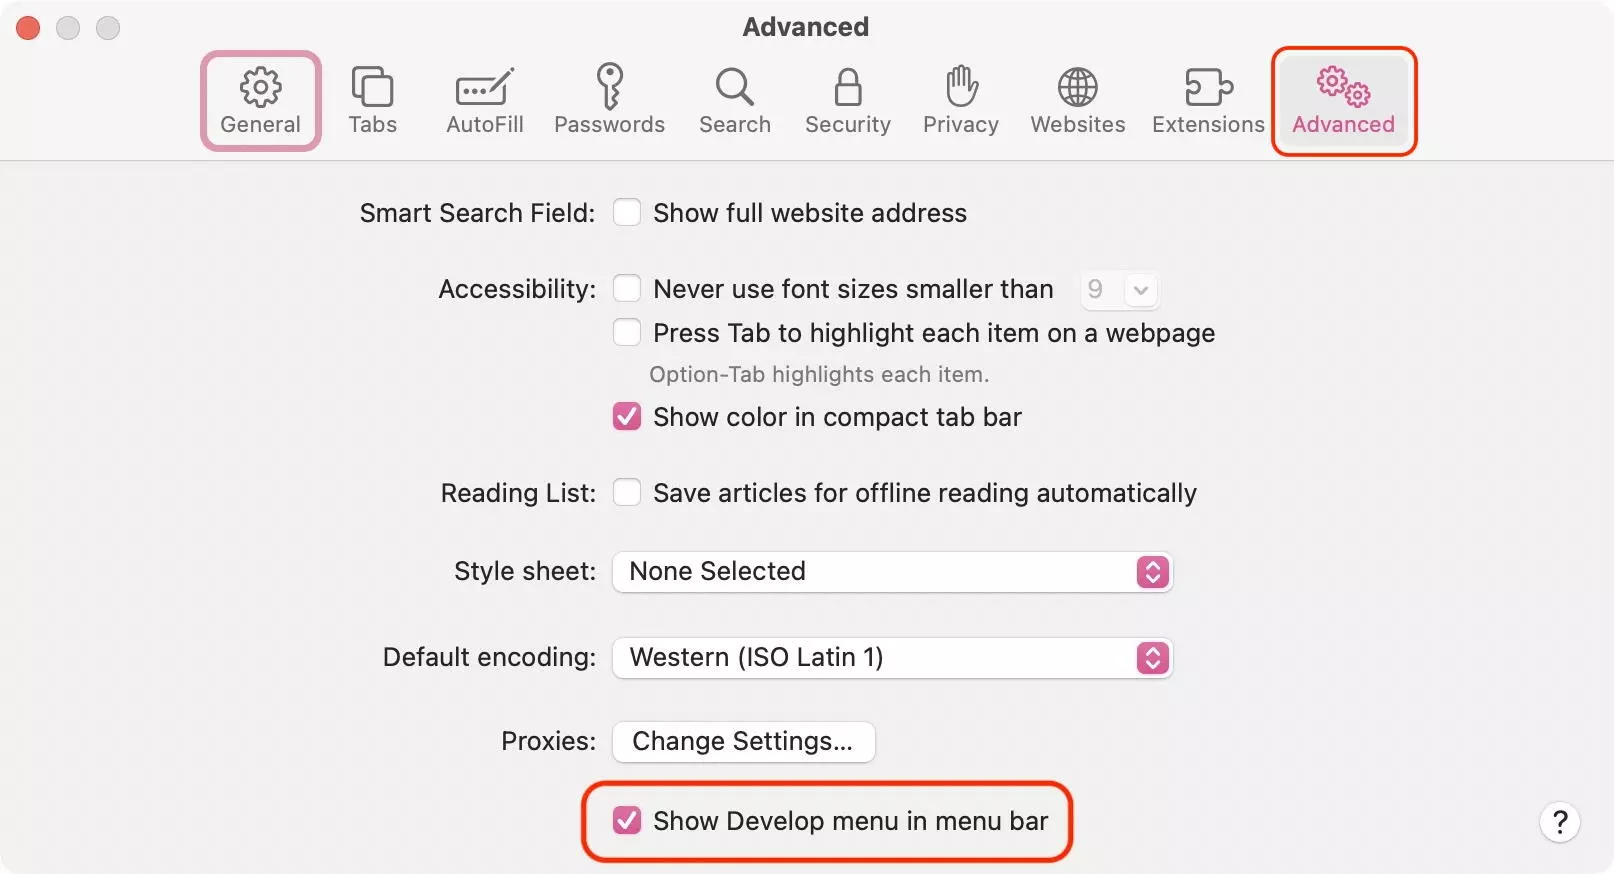
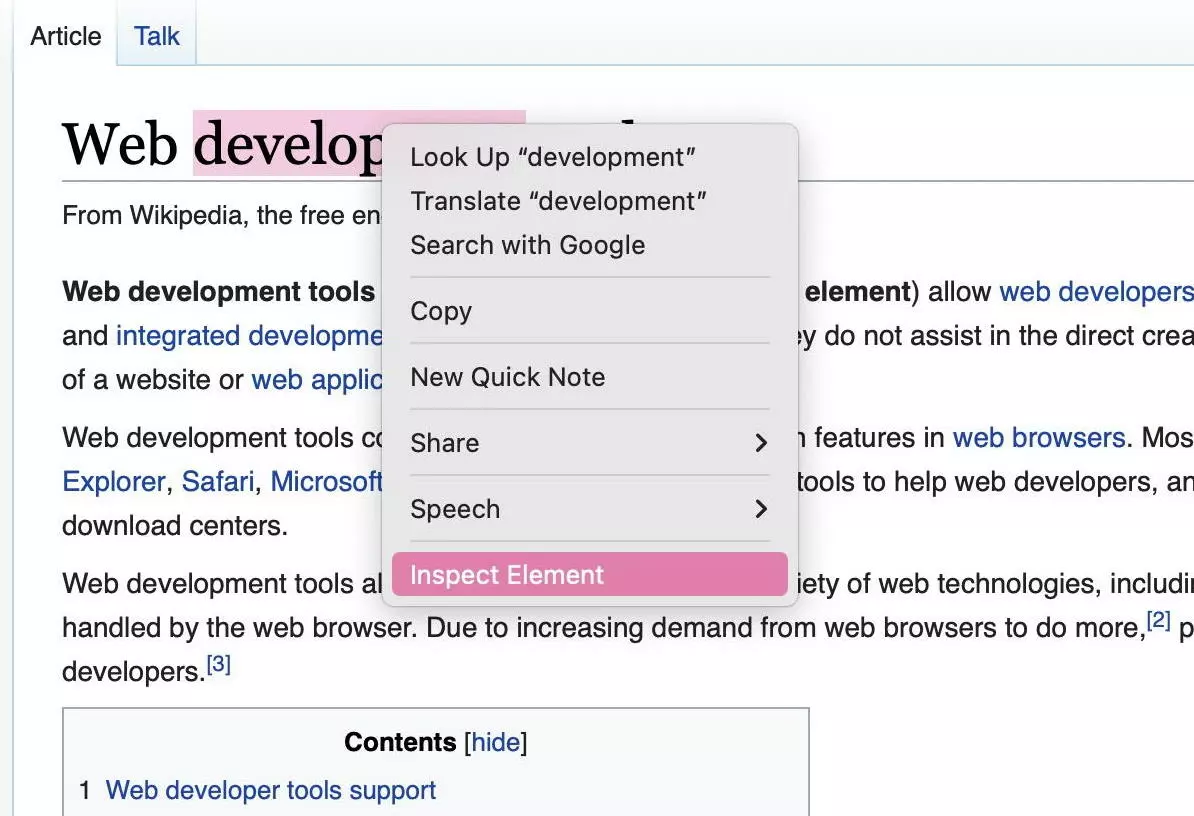
If you are using macOS Monterey in Safari, the developer tools are deactivated by default. To use “inspect element”, you need to first activate the feature in your settings under “advanced”. After you have activated the feature, you will see “inspect element” in the context menu:
There is a range of keyboard shortcuts you can use to open the tool. These are different depending on the browser and the operating system; however, some standards have been established. In each of the three most-used browsers, Chrome, Firefox and Safari, the shortcuts [Cmd] + [Option] + [i] (Mac) or [Ctrl] + [Shift] + [i] (Windows and Linux) work.
F12 can be used as an alternative shortcut in Chrome and Firefox. Both shortcuts are “toggles”, which, when frequently used, allow users to open and close Chrome DevTools.
| Browser | Windows + Linux | Mac |
|---|---|---|
| Chrome | F12 / Ctrl+Shift+i | F12 / Cmd+Option+i |
| Firefox | F12 / Ctrl+Shift+i | F12 / Cmd+Option+i |
| Safari | – | Cmd+Option+i |
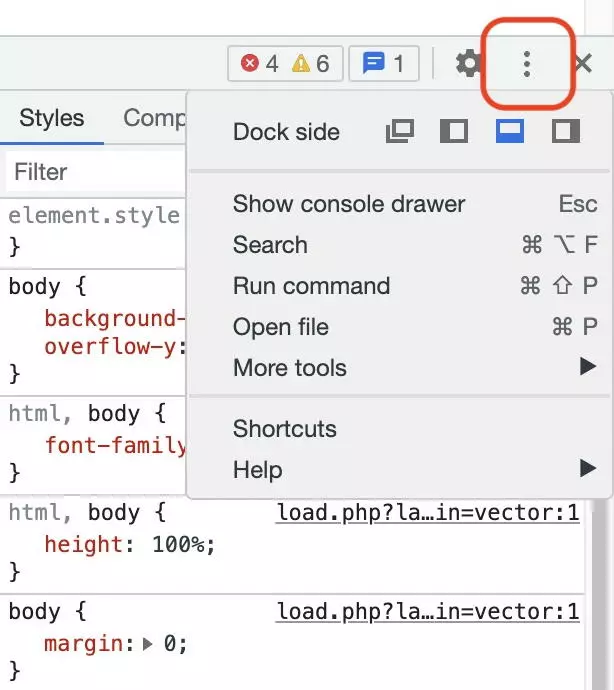
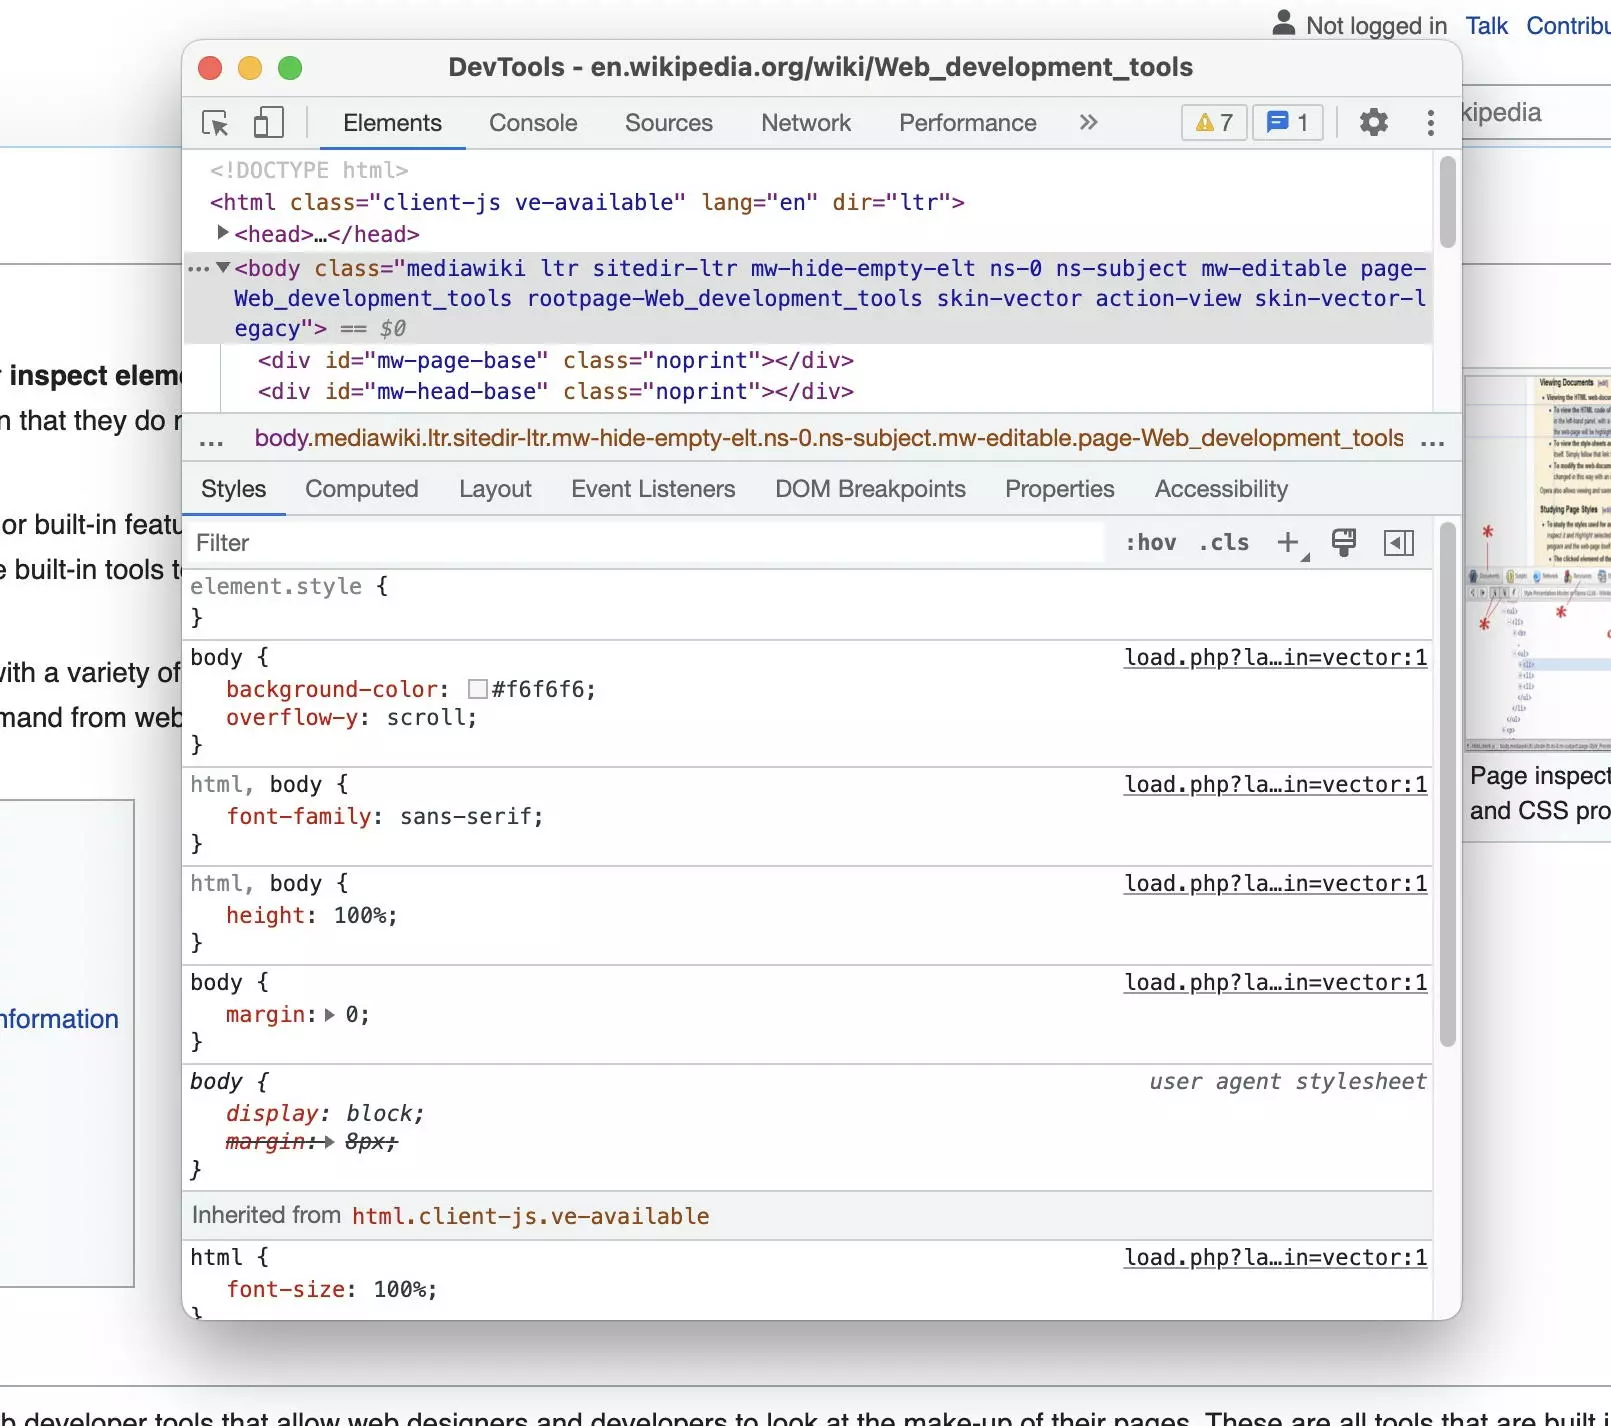
When opening Chrome DevTools, it will appear docked in the same window. You can choose to display it on the right, left or at the bottom of the website. You also have the option to display Chrome Developer Tools in a separate window. This is practical for intensive workloads, where having the website and the developer tools next to each other or split across different screens is ideal.
In the following screenshots we will only show Chrome Developer Tools.
Can you inspect a website using Chrome DevTools on a smartphone?
While “inspect element” is standard on desktops and all browsers, it is not readily available on smartphones. There is simply not enough place on a small screen to display DevTools. Moreover, not having a mouse makes precise movements difficult. In iOS, it is even more difficult, because all browsers are limited to Apple’s WebKit browser engine.
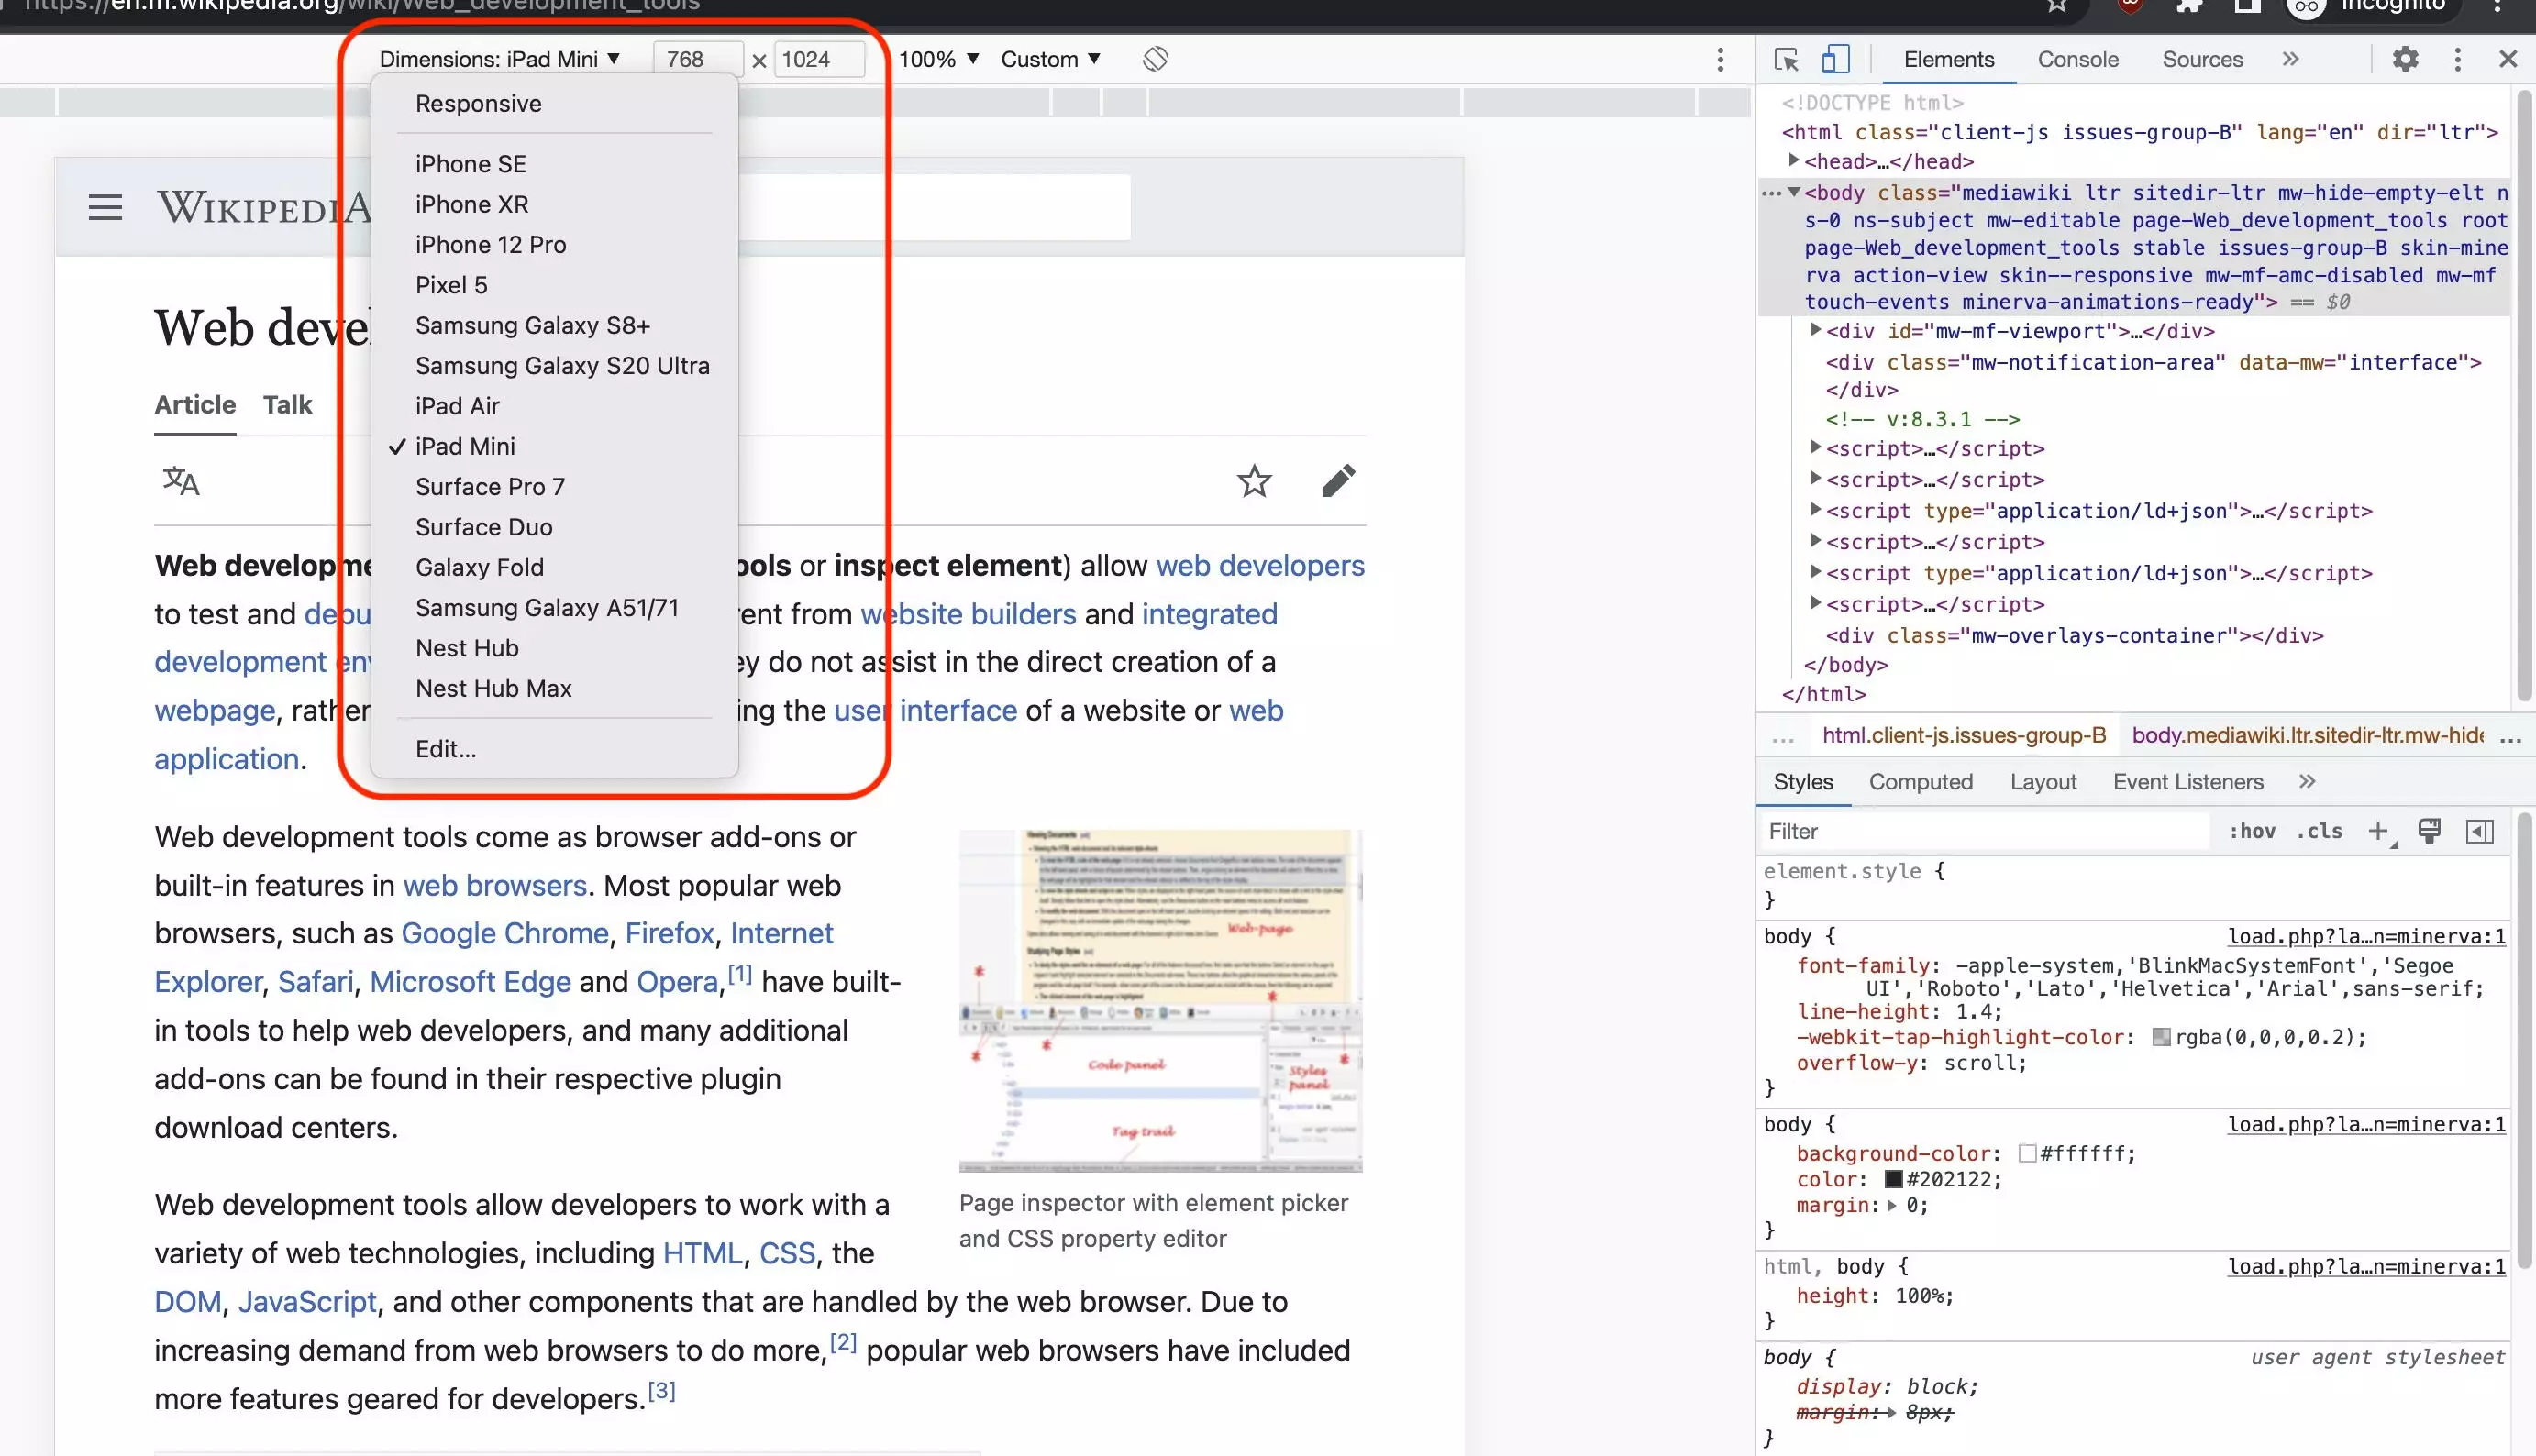
Instead of using Chrome DevTools on a smartphone, you can use emulators to simulate a mobile device on a browser. The responsive mode in DevTools is particularly useful. It’s also possible to connect physical iOS and Android devices with a desktop computer. The website to be inspected can then be examined in the desktop browser when open. To do this on iOS, you need to use a Mac and the same iCloud account on both devices.
How are (Chrome) developer tools used?
Chrome Developer Tools work for all content displayed in a browser and are often used in the areas of development, design and SEO. Due to the extensive development of web technology, there are additional areas in which it can also be used. Below we will give you an overview of different features and use cases.
Web development
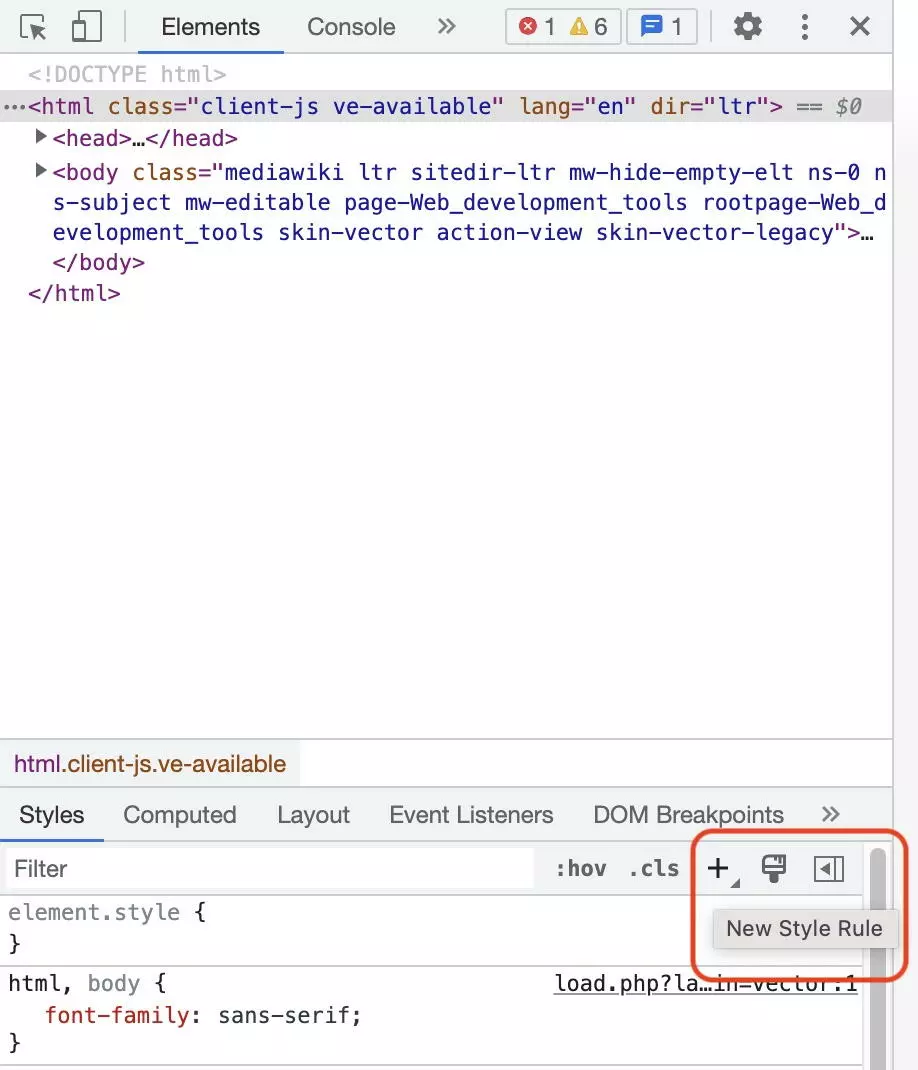
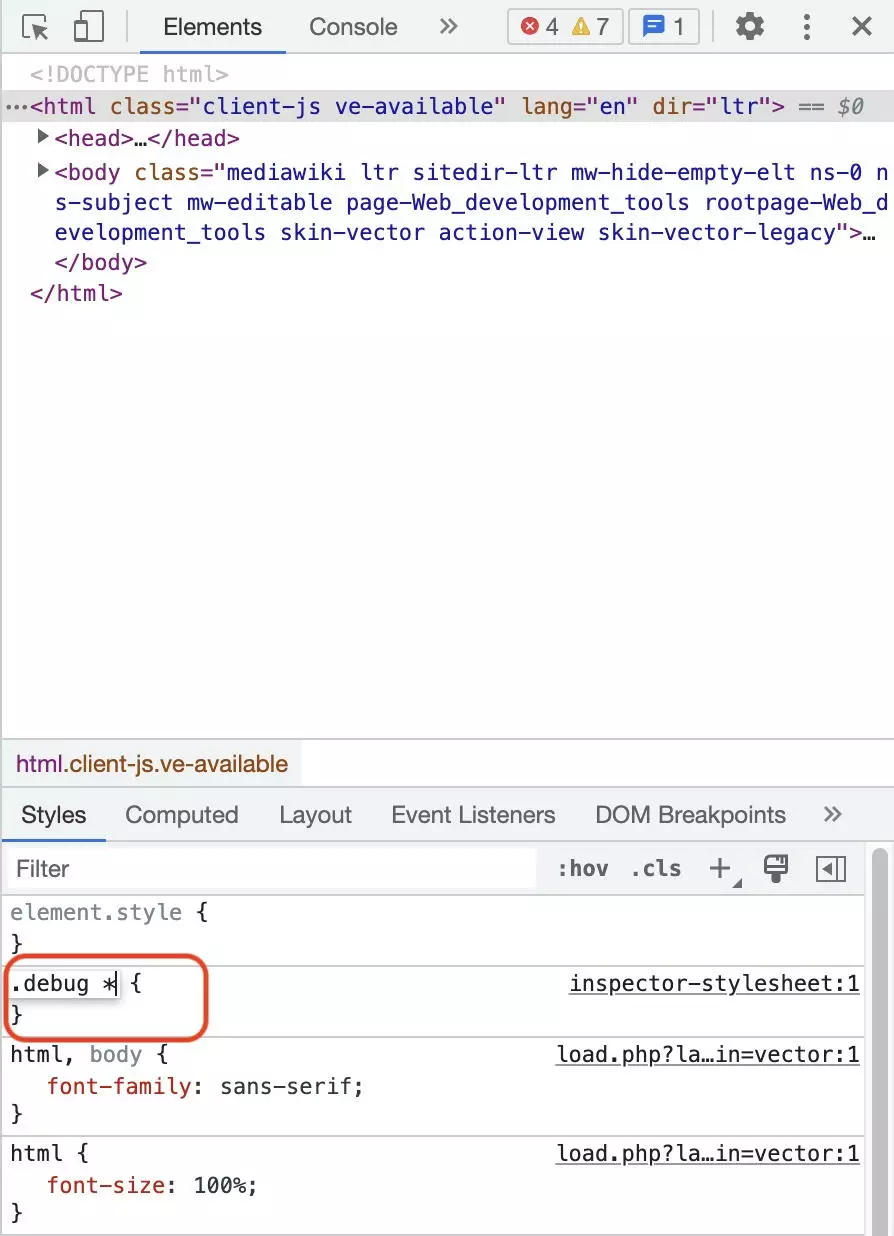
Chrome Developer Tools are used during web development to prototype, test and find errors. One great benefit is that new CSS-style rules can be defined and used in elements. Here’s an example of a debug class. If we assign an element to a class, all child elements will be displayed in red text. Additionally, the elements will have a golden border. This makes it easy to diagnose layout errors. You can do this by using the CSS code below:
.debug * {
 color: red !important;
 outline: 1px solid gold;
}
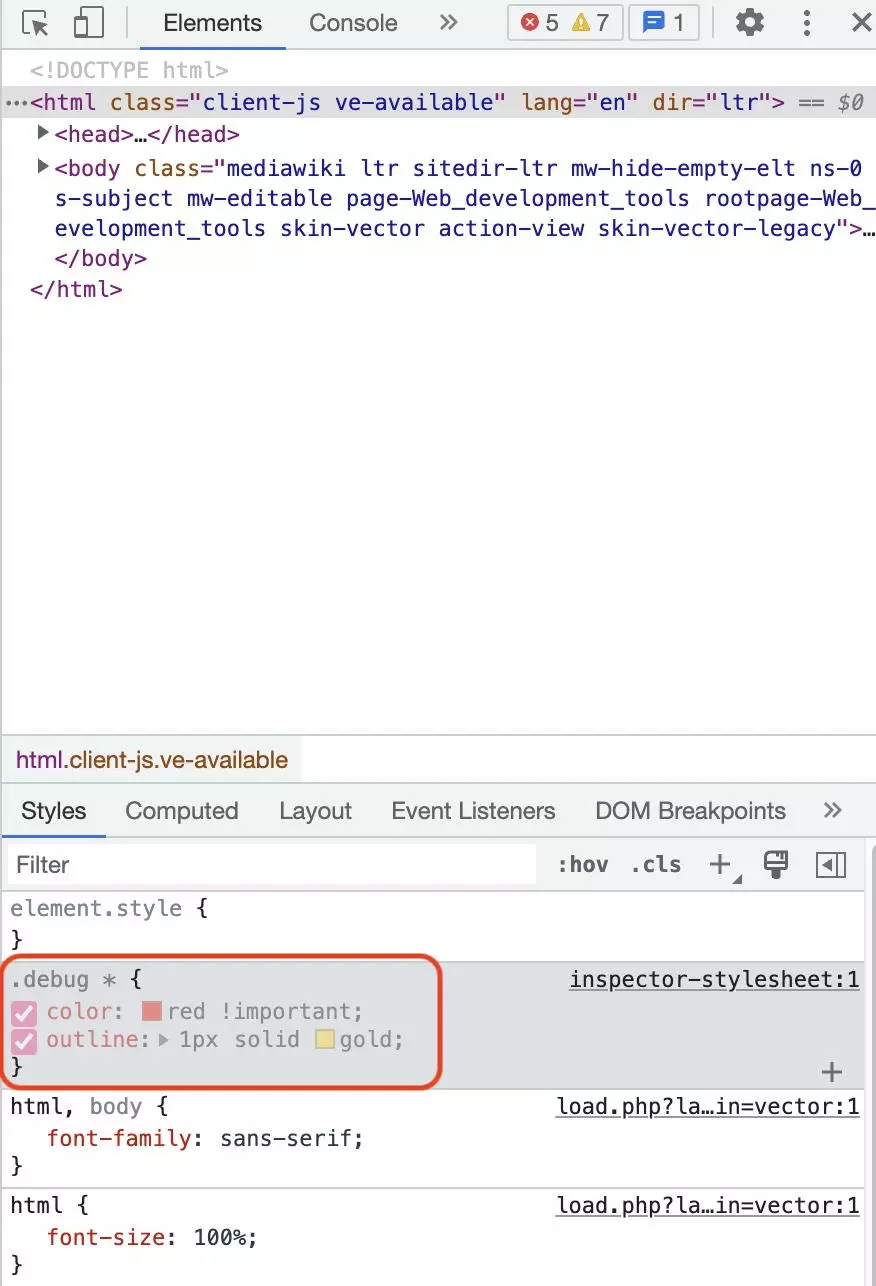
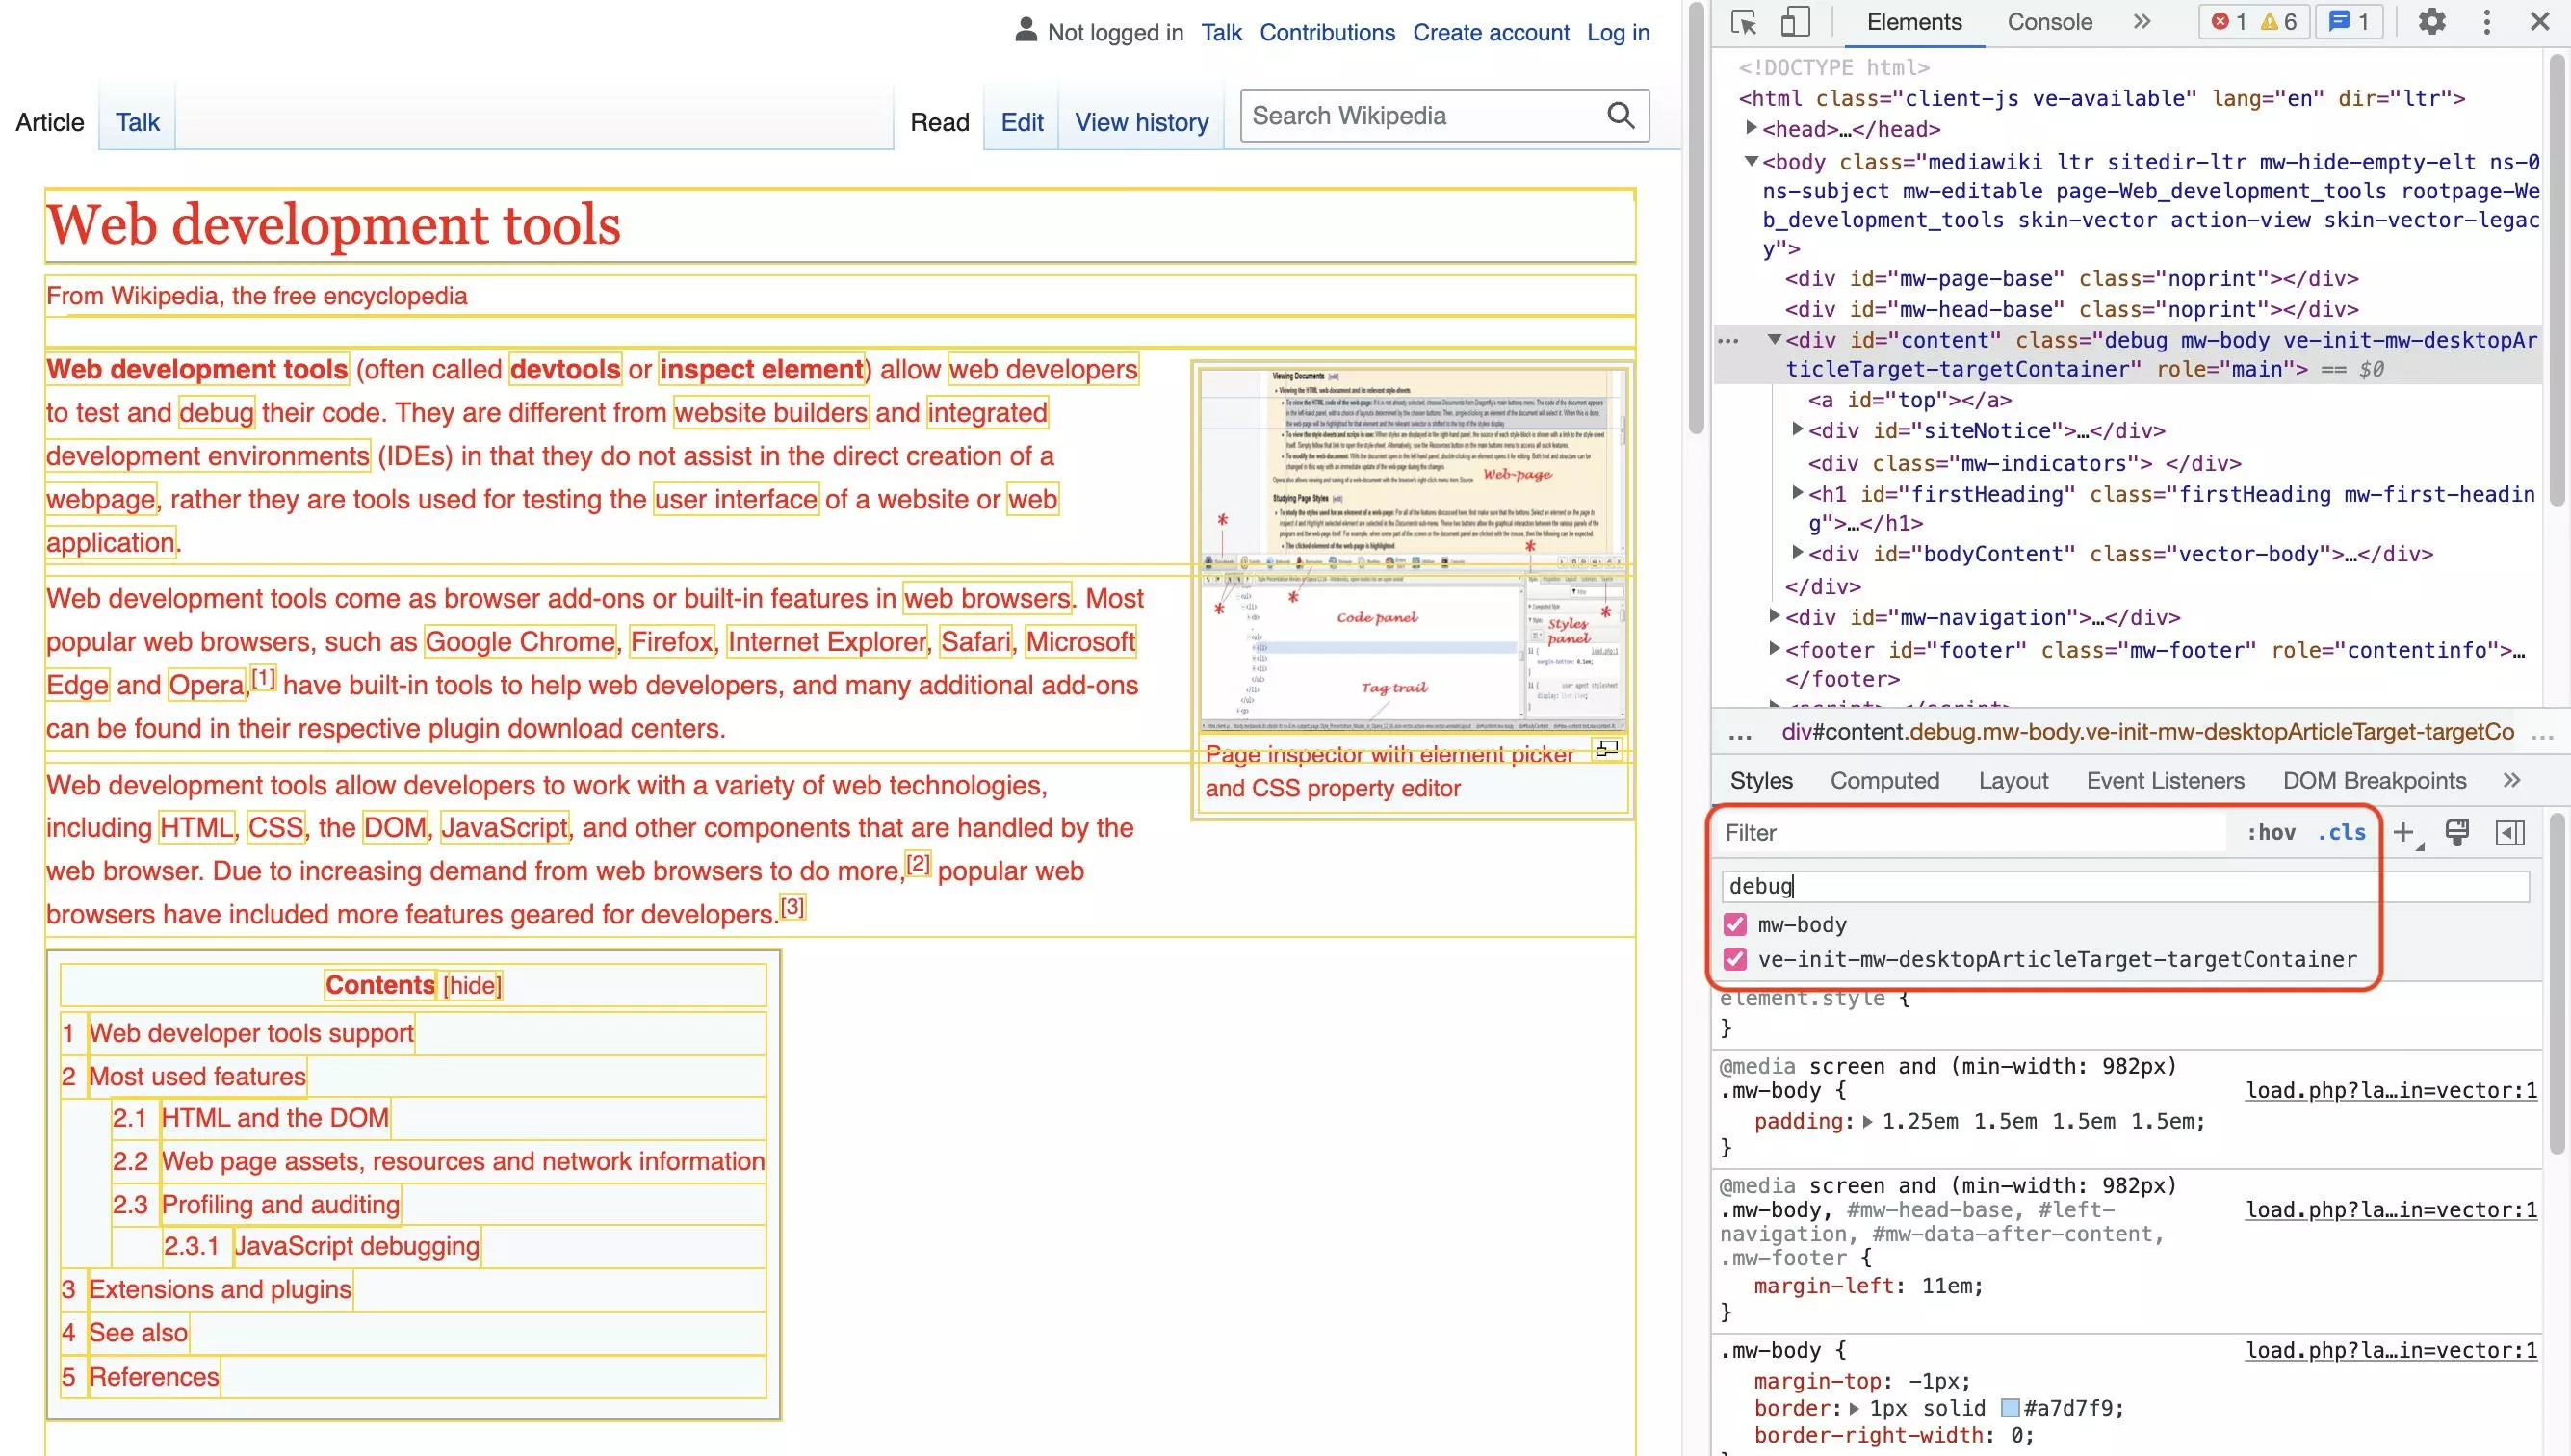
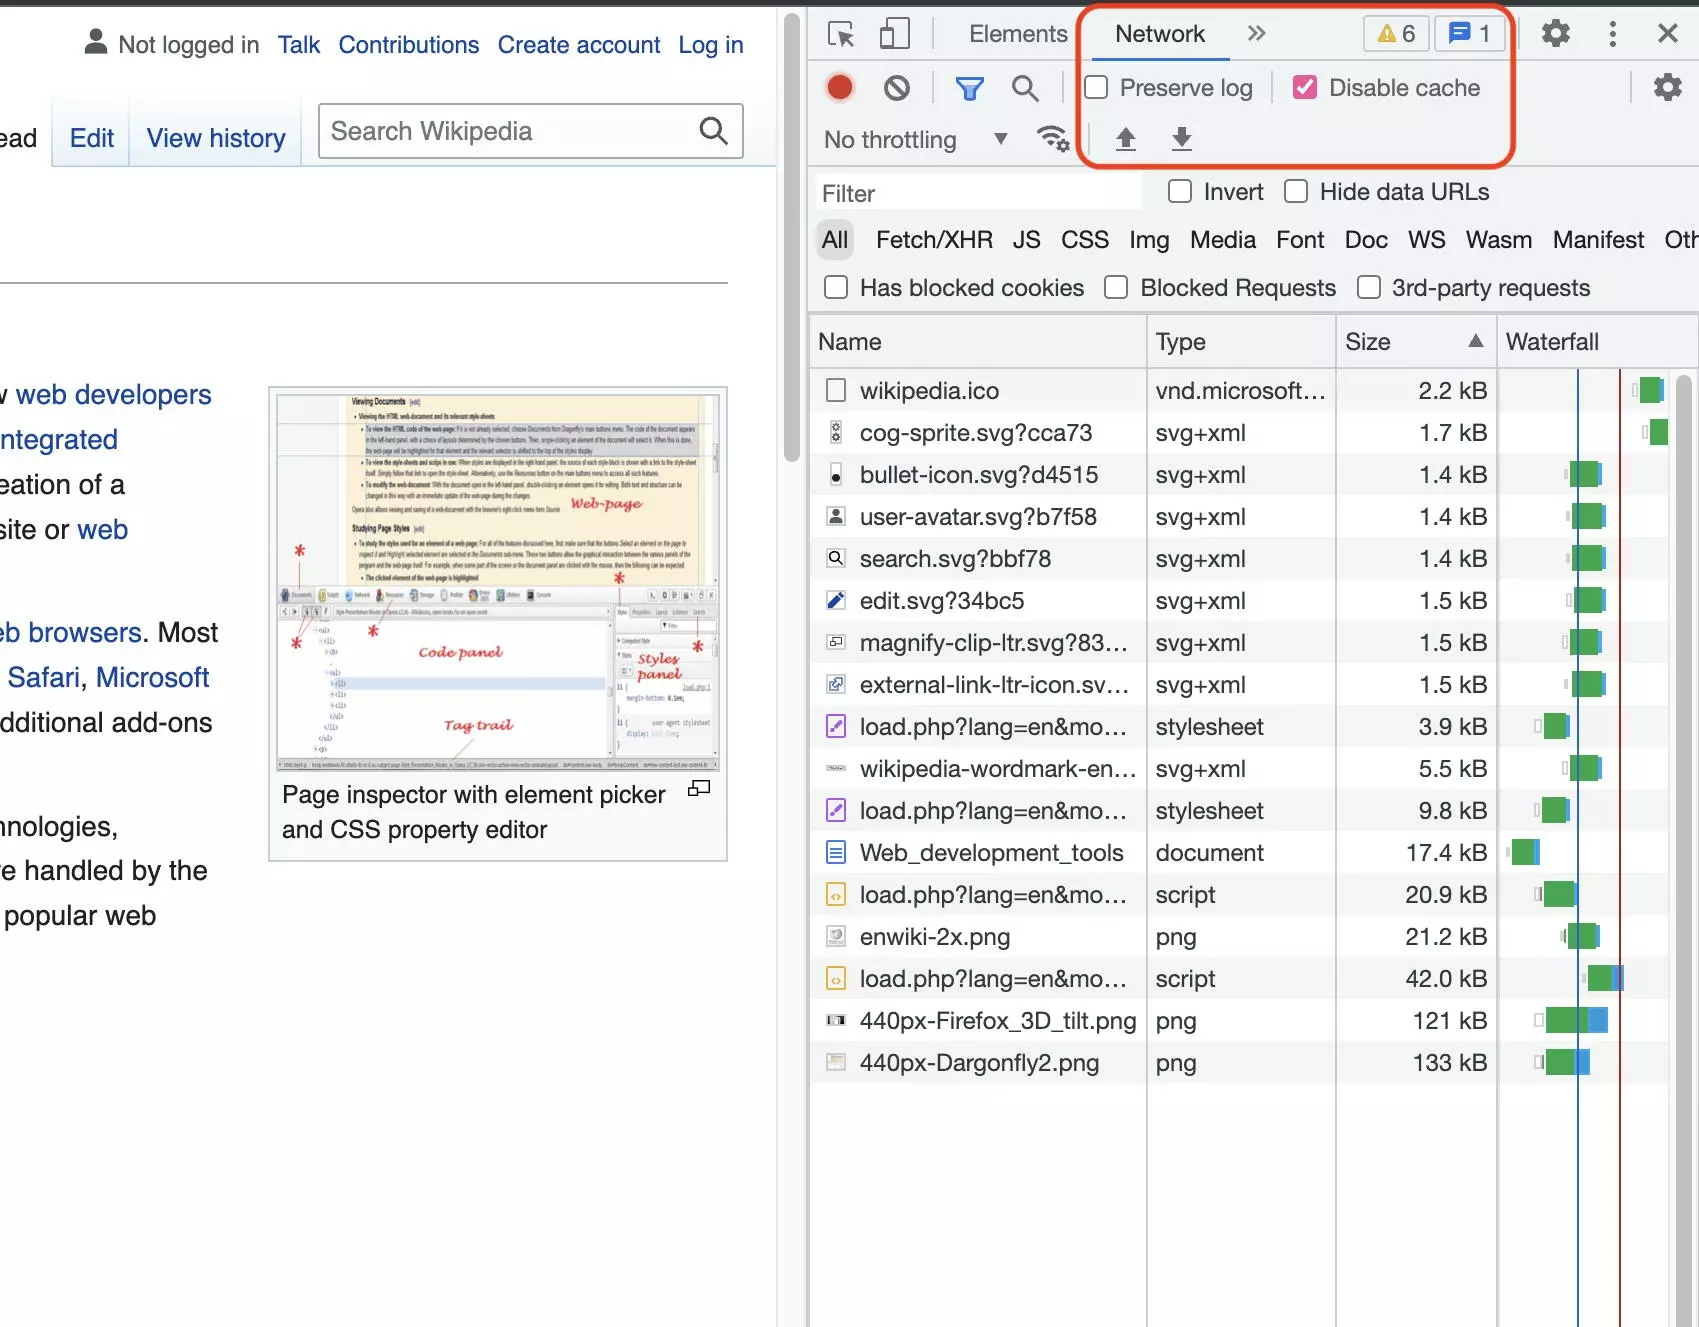
To use Chrome Developer Tools for troubleshooting and analysis, you must deactivate the browser cache. Otherwise, possible resources may be loaded from the local cache. This results in elements being displayed that do not reflect the actual circumstances. The settings to deactivate the cache is in the network tab. You can also use the network tab to analyze ERR_SSL_PROTOCOL_ERRORS.
It is often useful to access the inspected element in the JavaScript console of Chrome Developer Tools. For practical purposes, the browser uses the variable $0 to refer to the inspected element. It is a completely normal DOM object, whose properties and methods users can access. Here are a few examples of useful interactions with the inspected element:
# currently inspected element
$0
# get classes of inspected element
$0.classList
# get ID of inspected element
$0.getAttribute('id')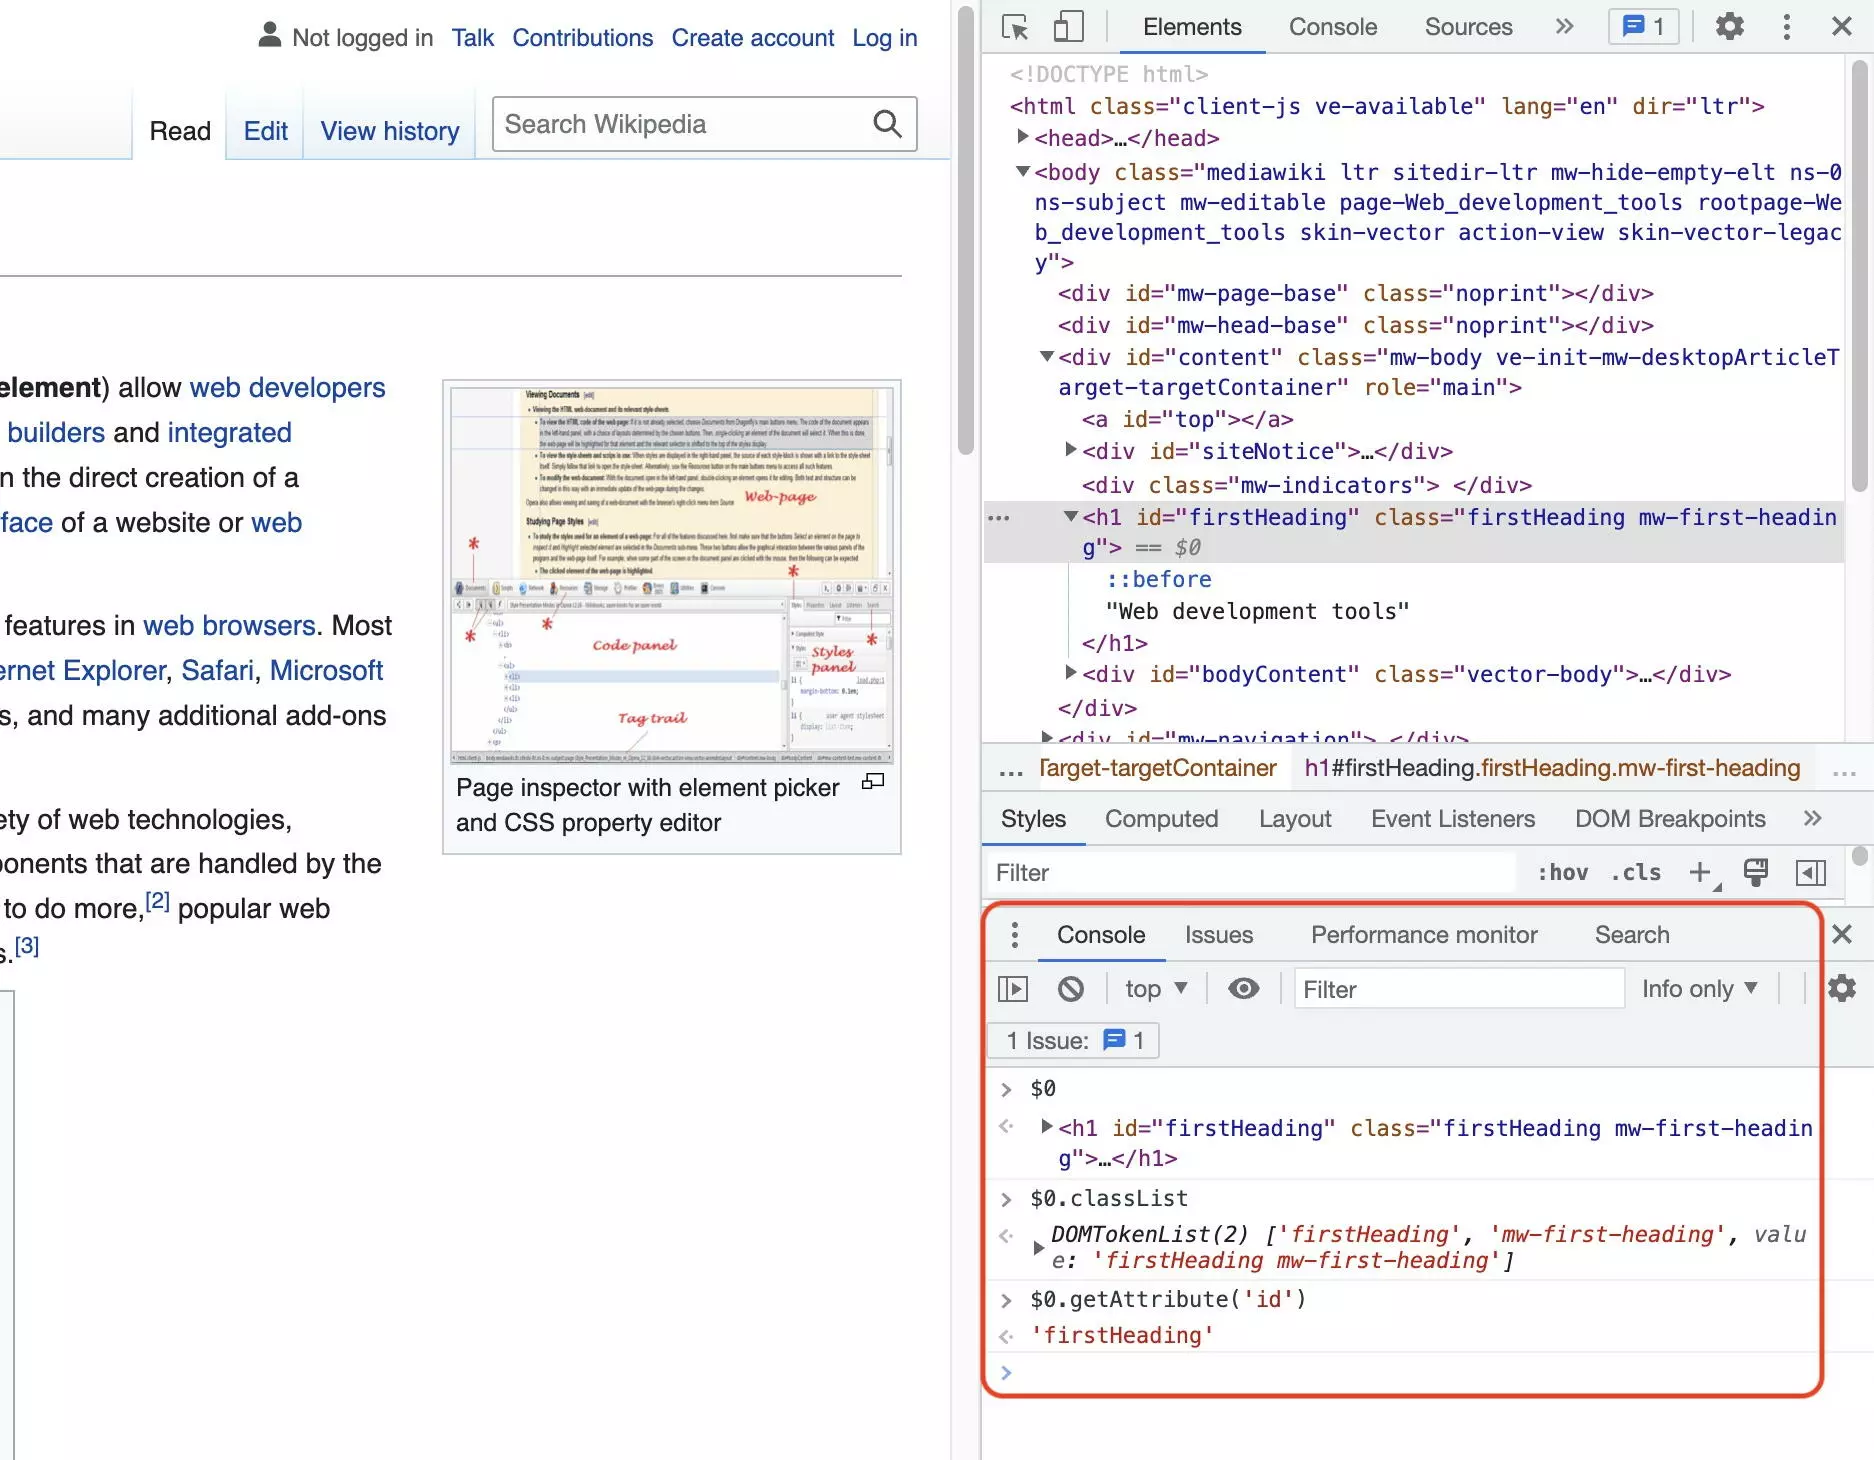
Want to build your own website? IONOS has different solutions to make your debut on the web easier. In just a few clicks, you can create your own website with your own domain using MyWebsite Now – IONOS. Enjoy more flexibility with a webhosting plan.
Web design
Chrome Developer Tools are widely used in web design. They are essential for the creation of responsive designs with utility frameworks such as Tailwind CSS. They allow users to quickly switch an element’s classes on and off and then show the corresponding results immediately. On top of this, they allow the calculated CSS values of the inspected element to be read out.
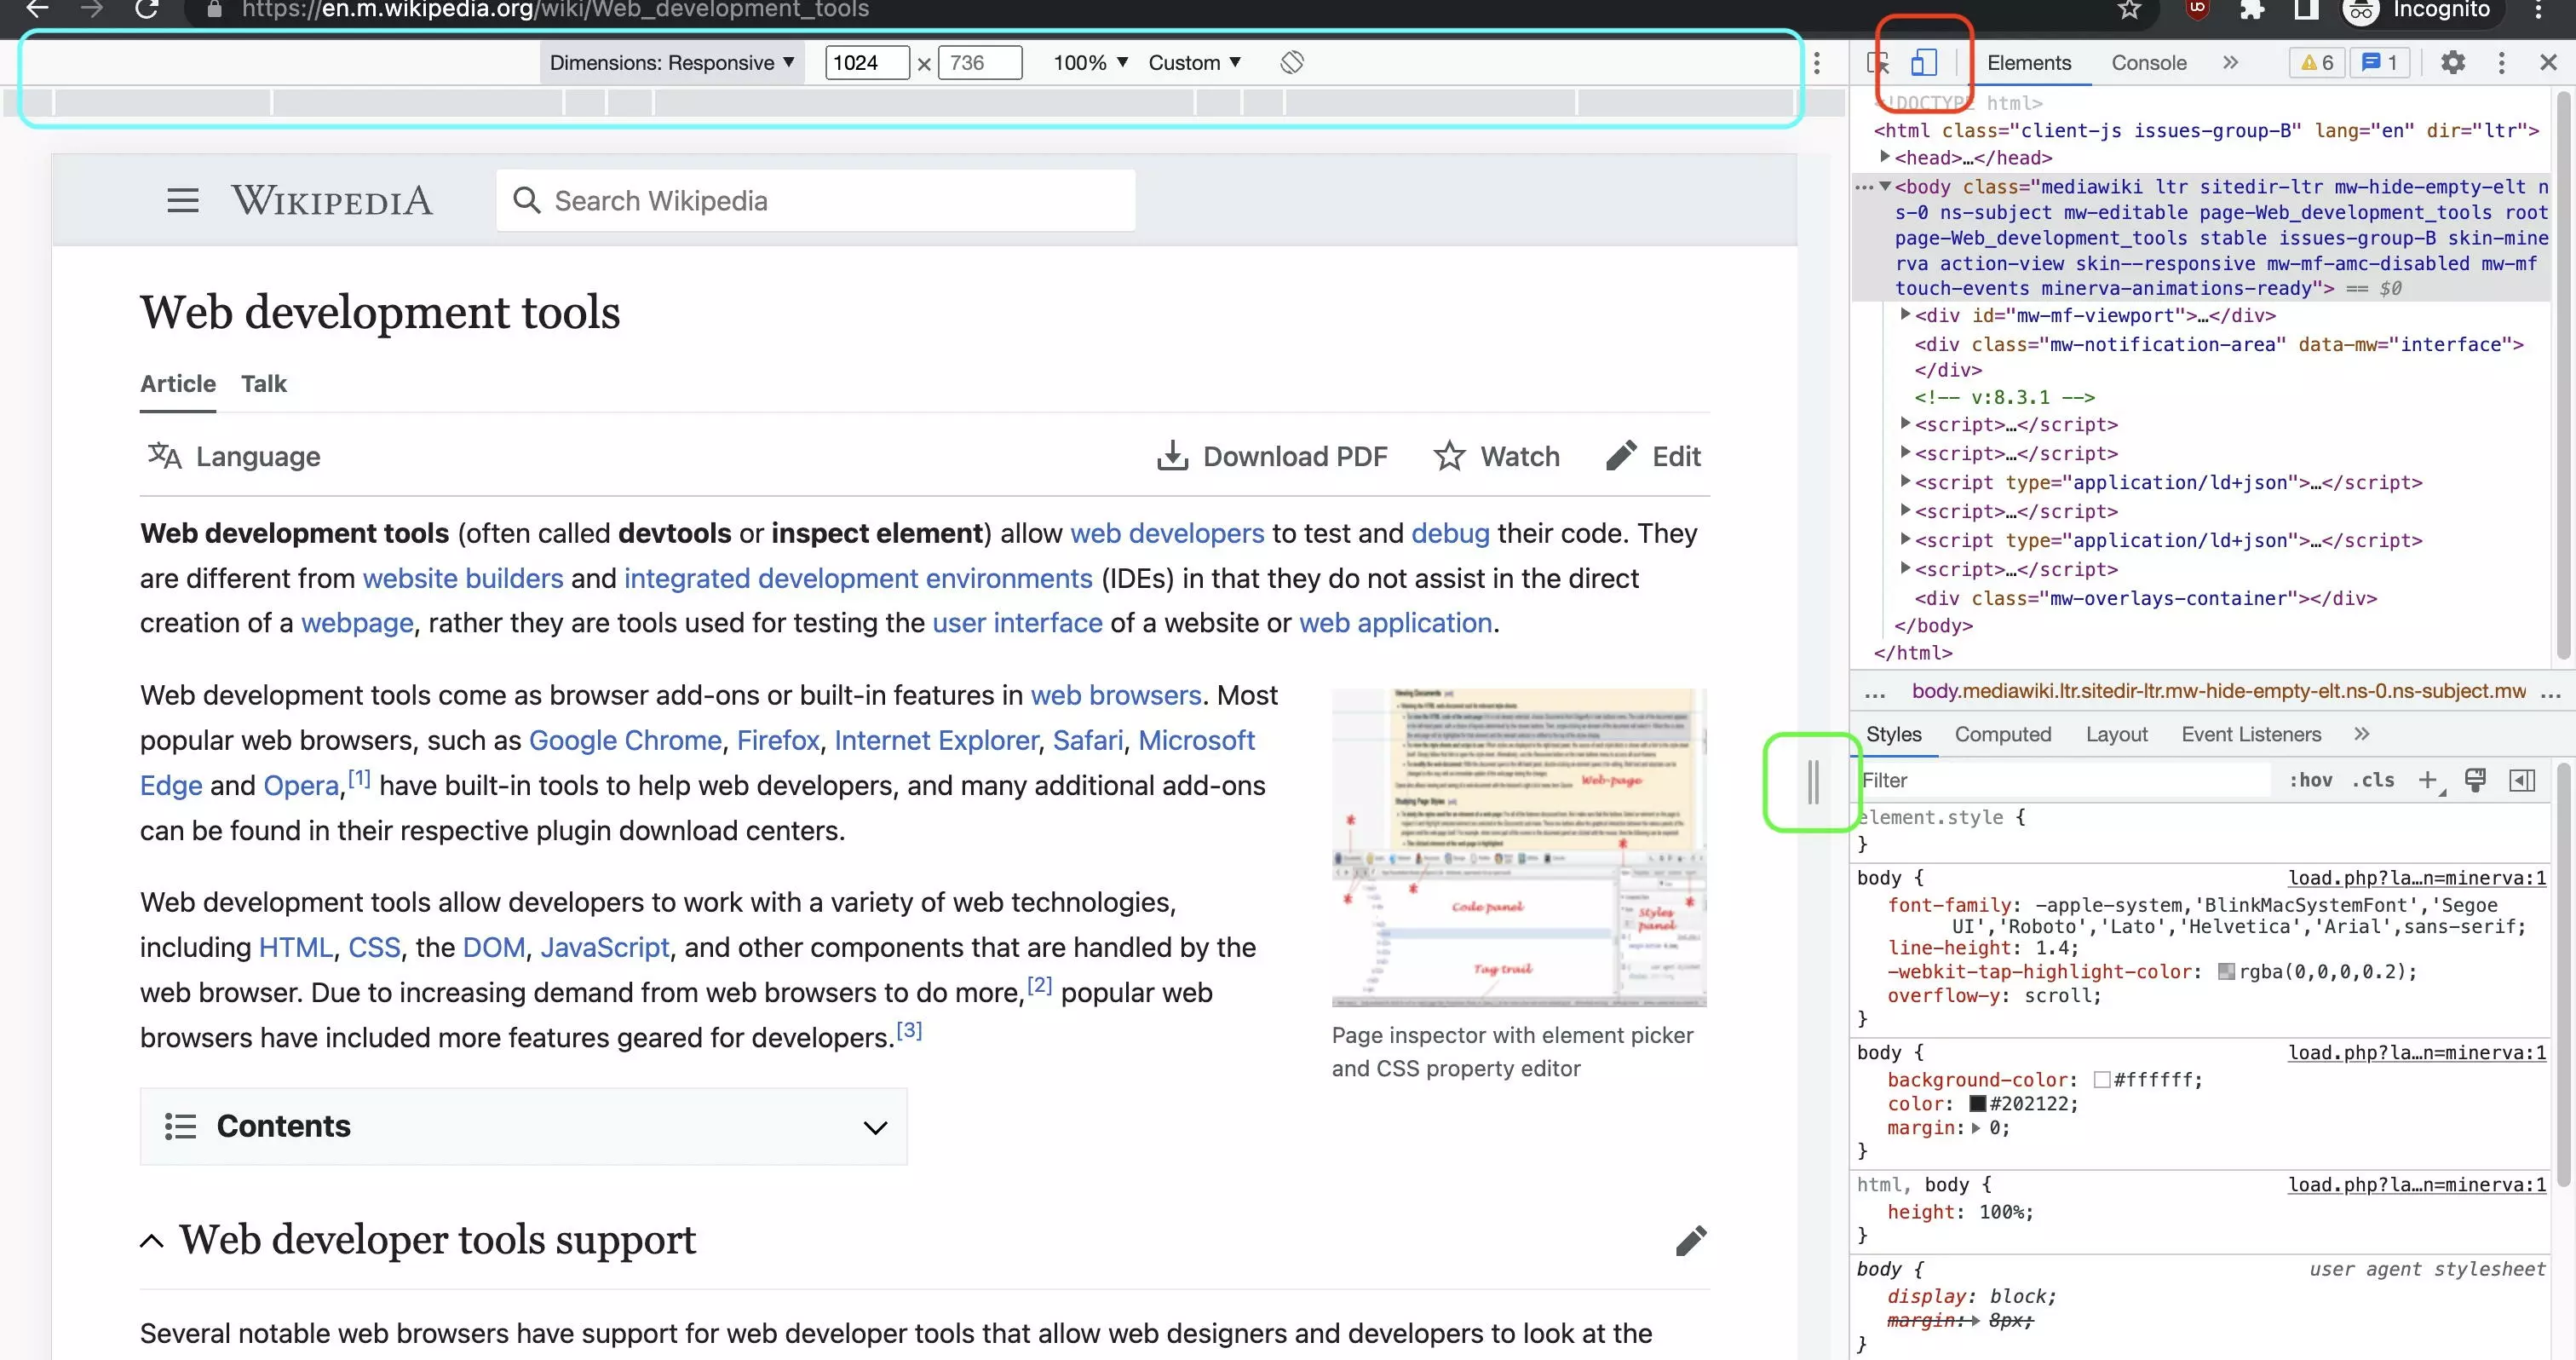
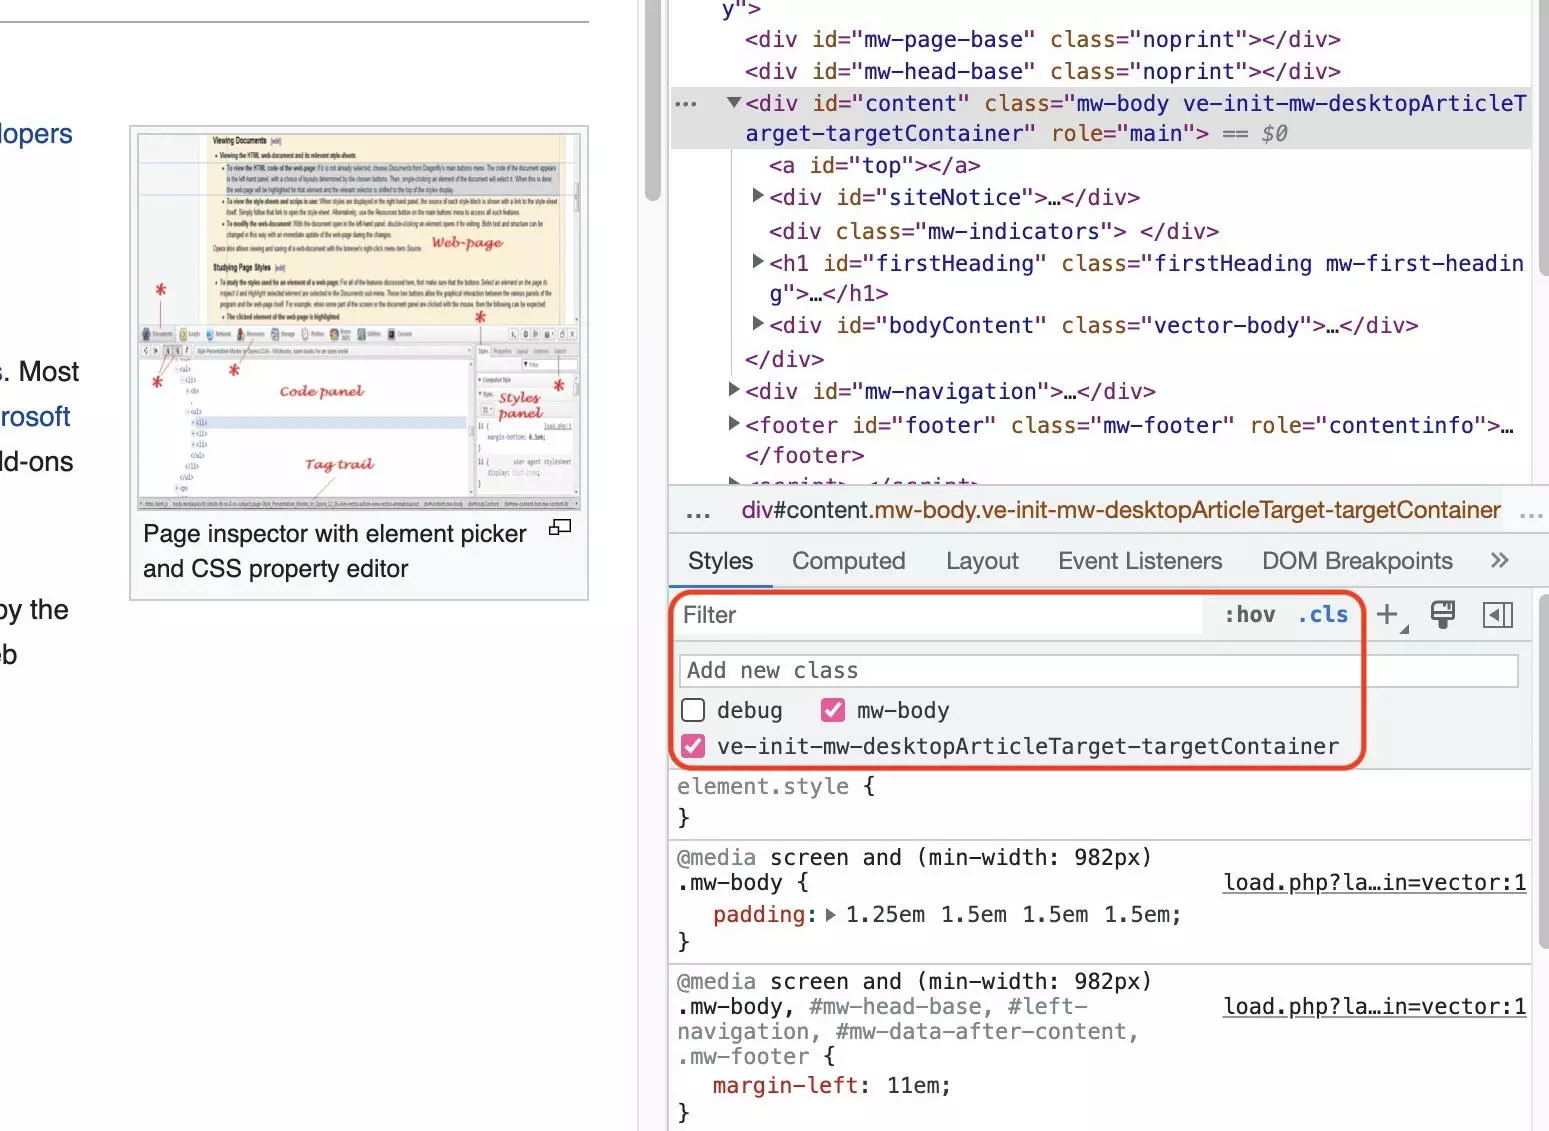
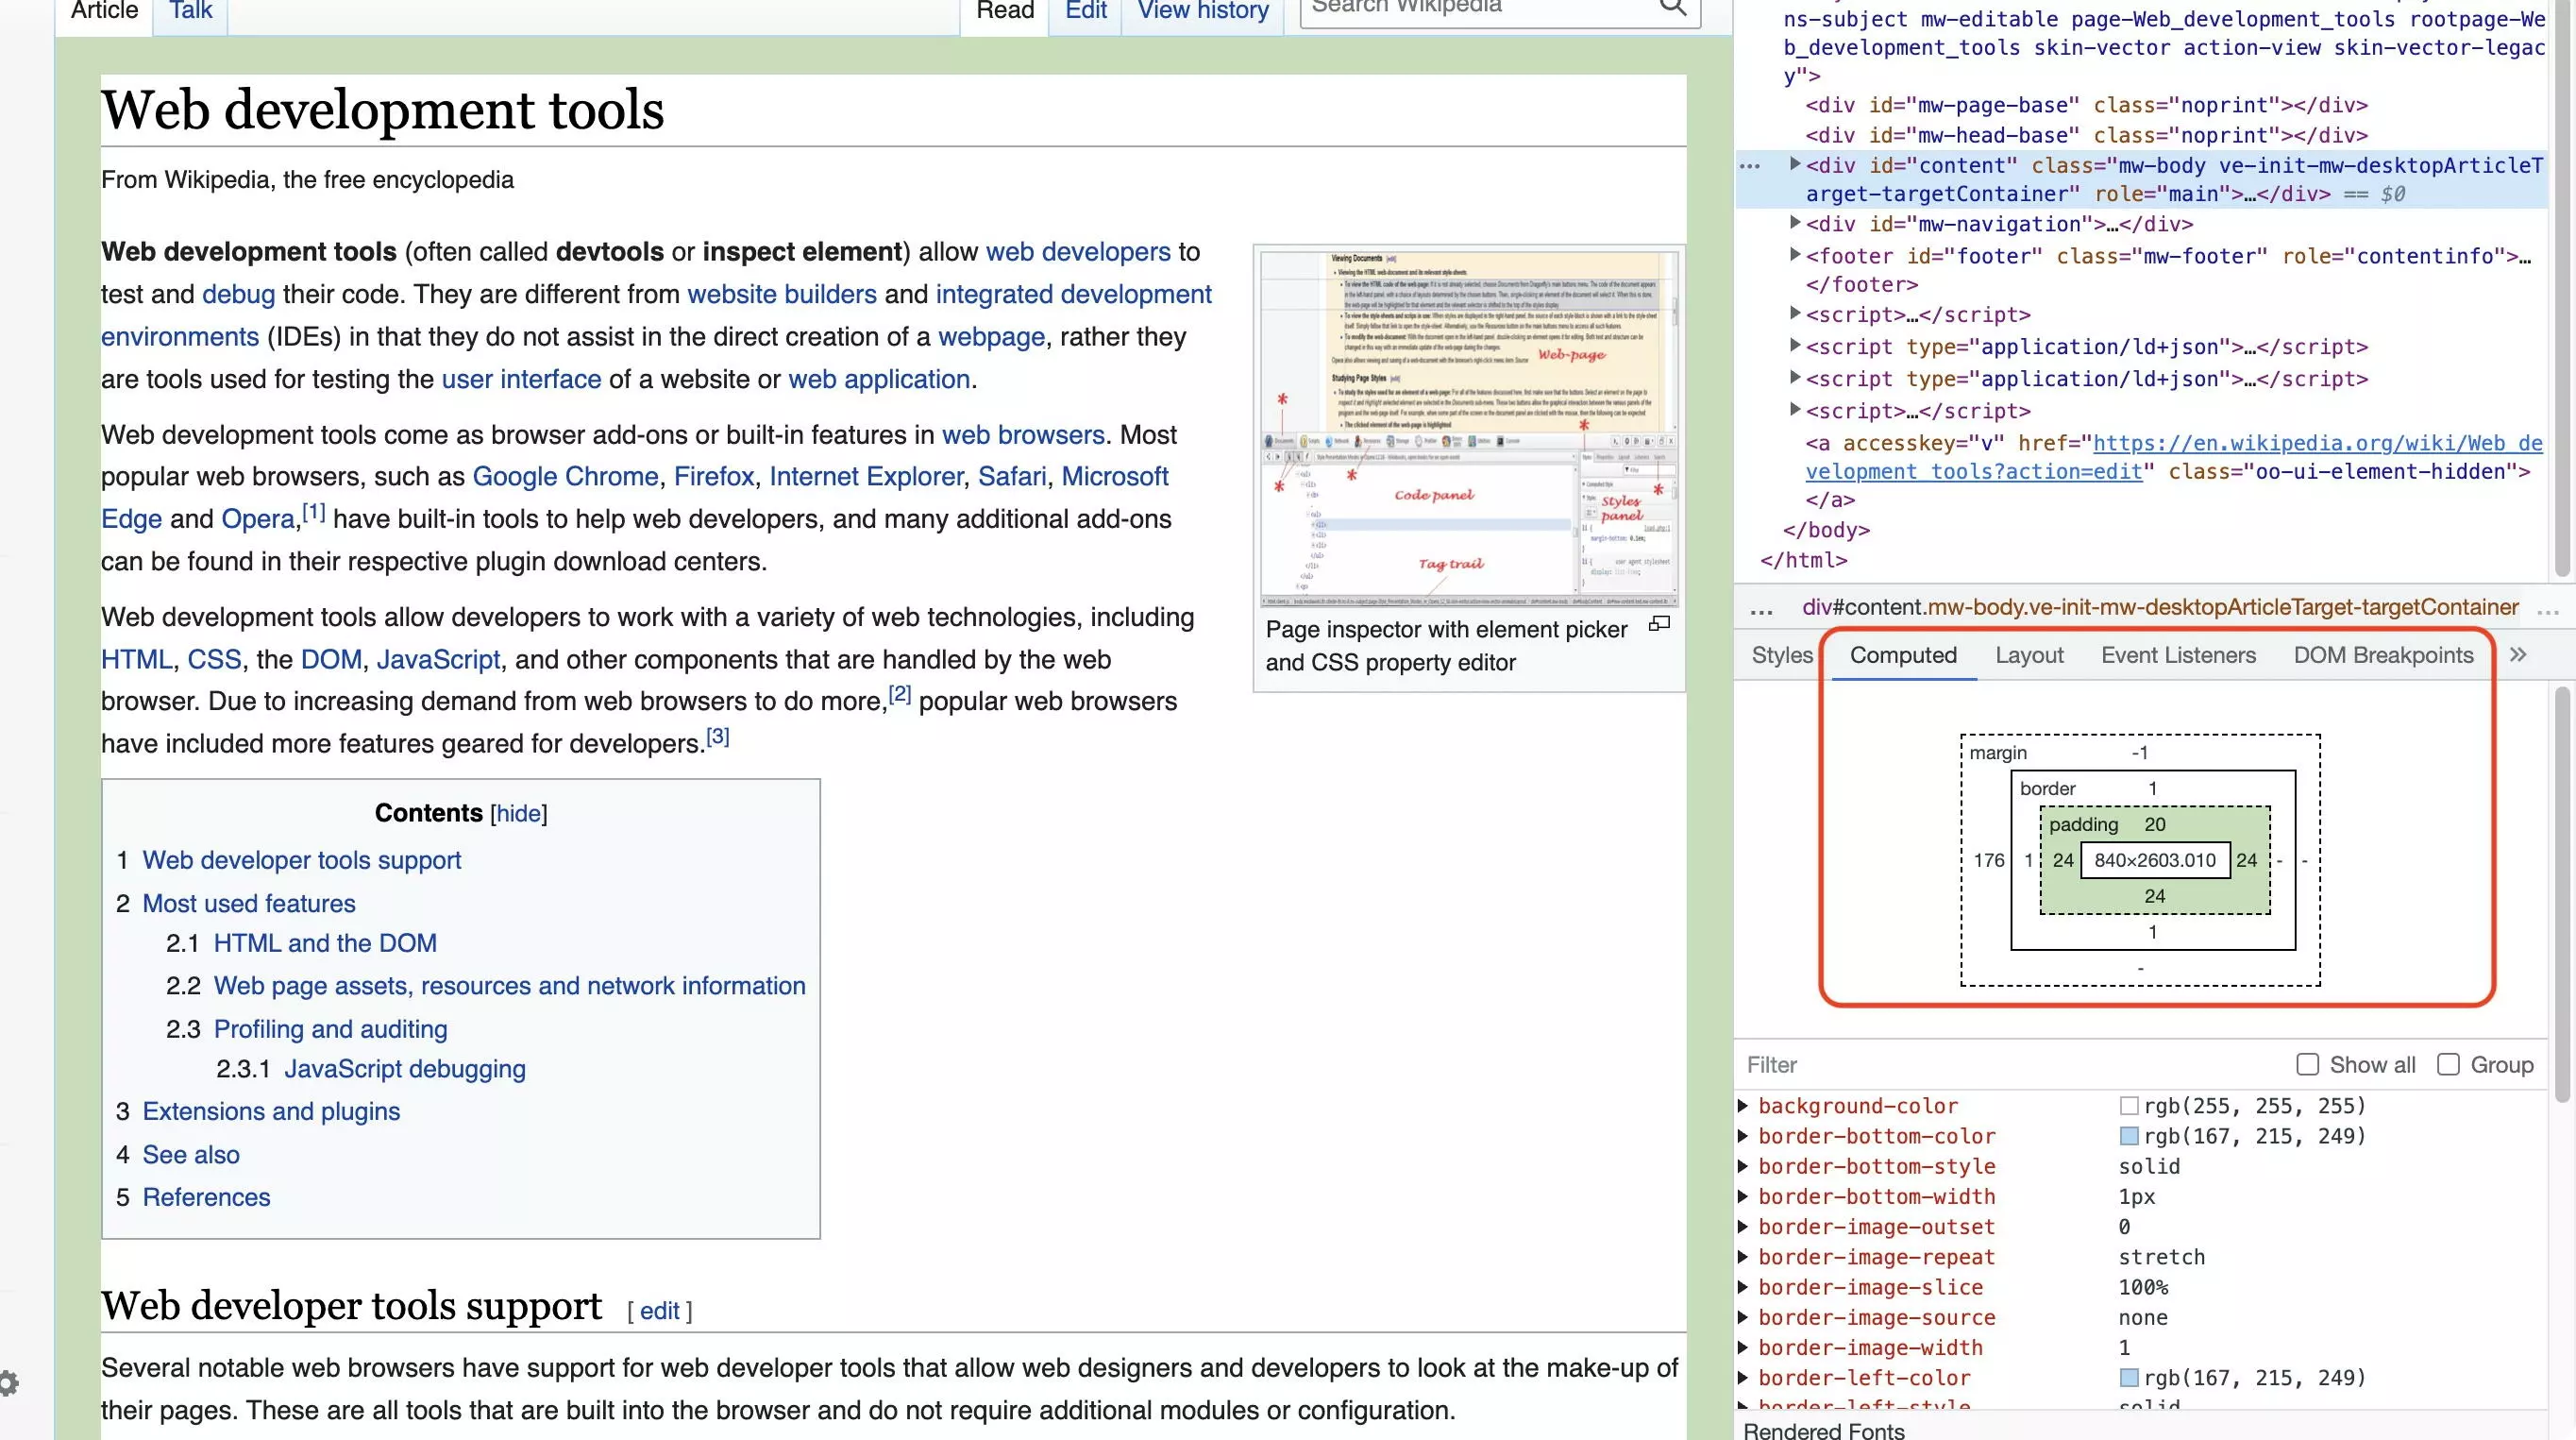
Get support for web design with IONOS’ website builder. You can use templates to build a professional website without any CSS knowledge. You can also create a business website that comes with an imprint, cookie warning and privacy information included.
Search engine optimization (SEO)
Chrome Development Tools are also used for search engine optimization. Semantically correct labelling of headlines is an important on-page feature of SEO. You can use the “inspect element” feature to analyze the heading structure:
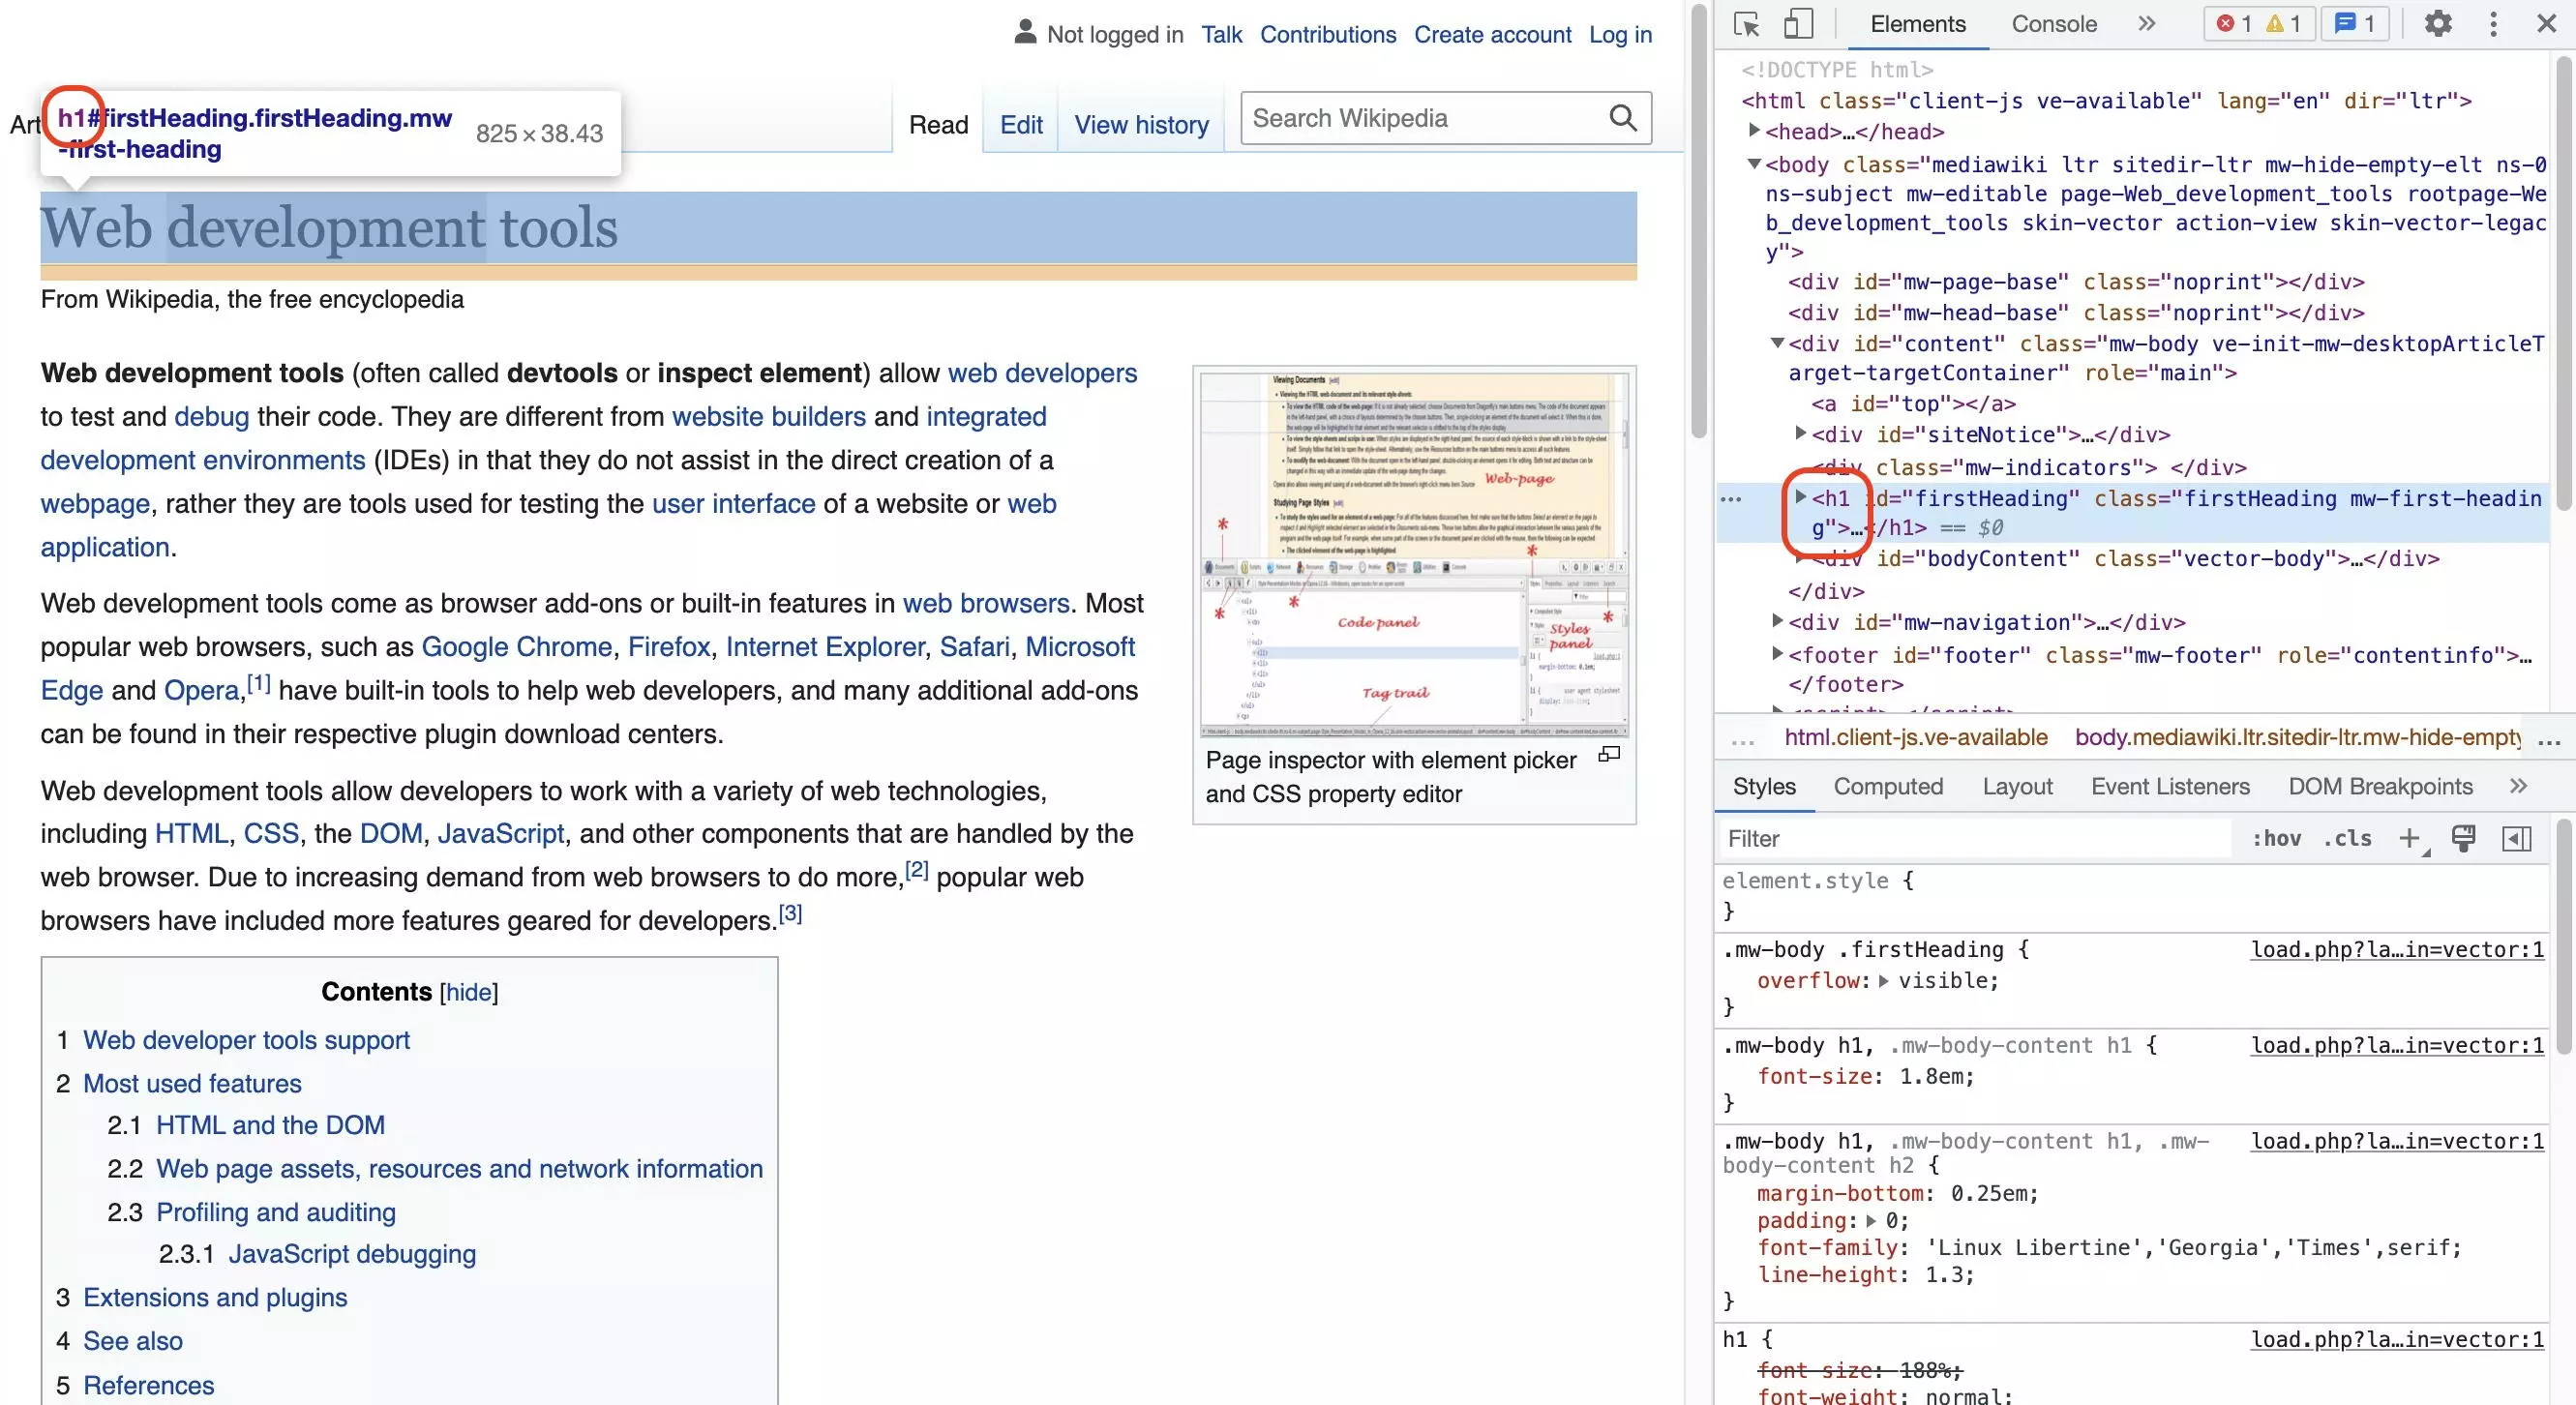
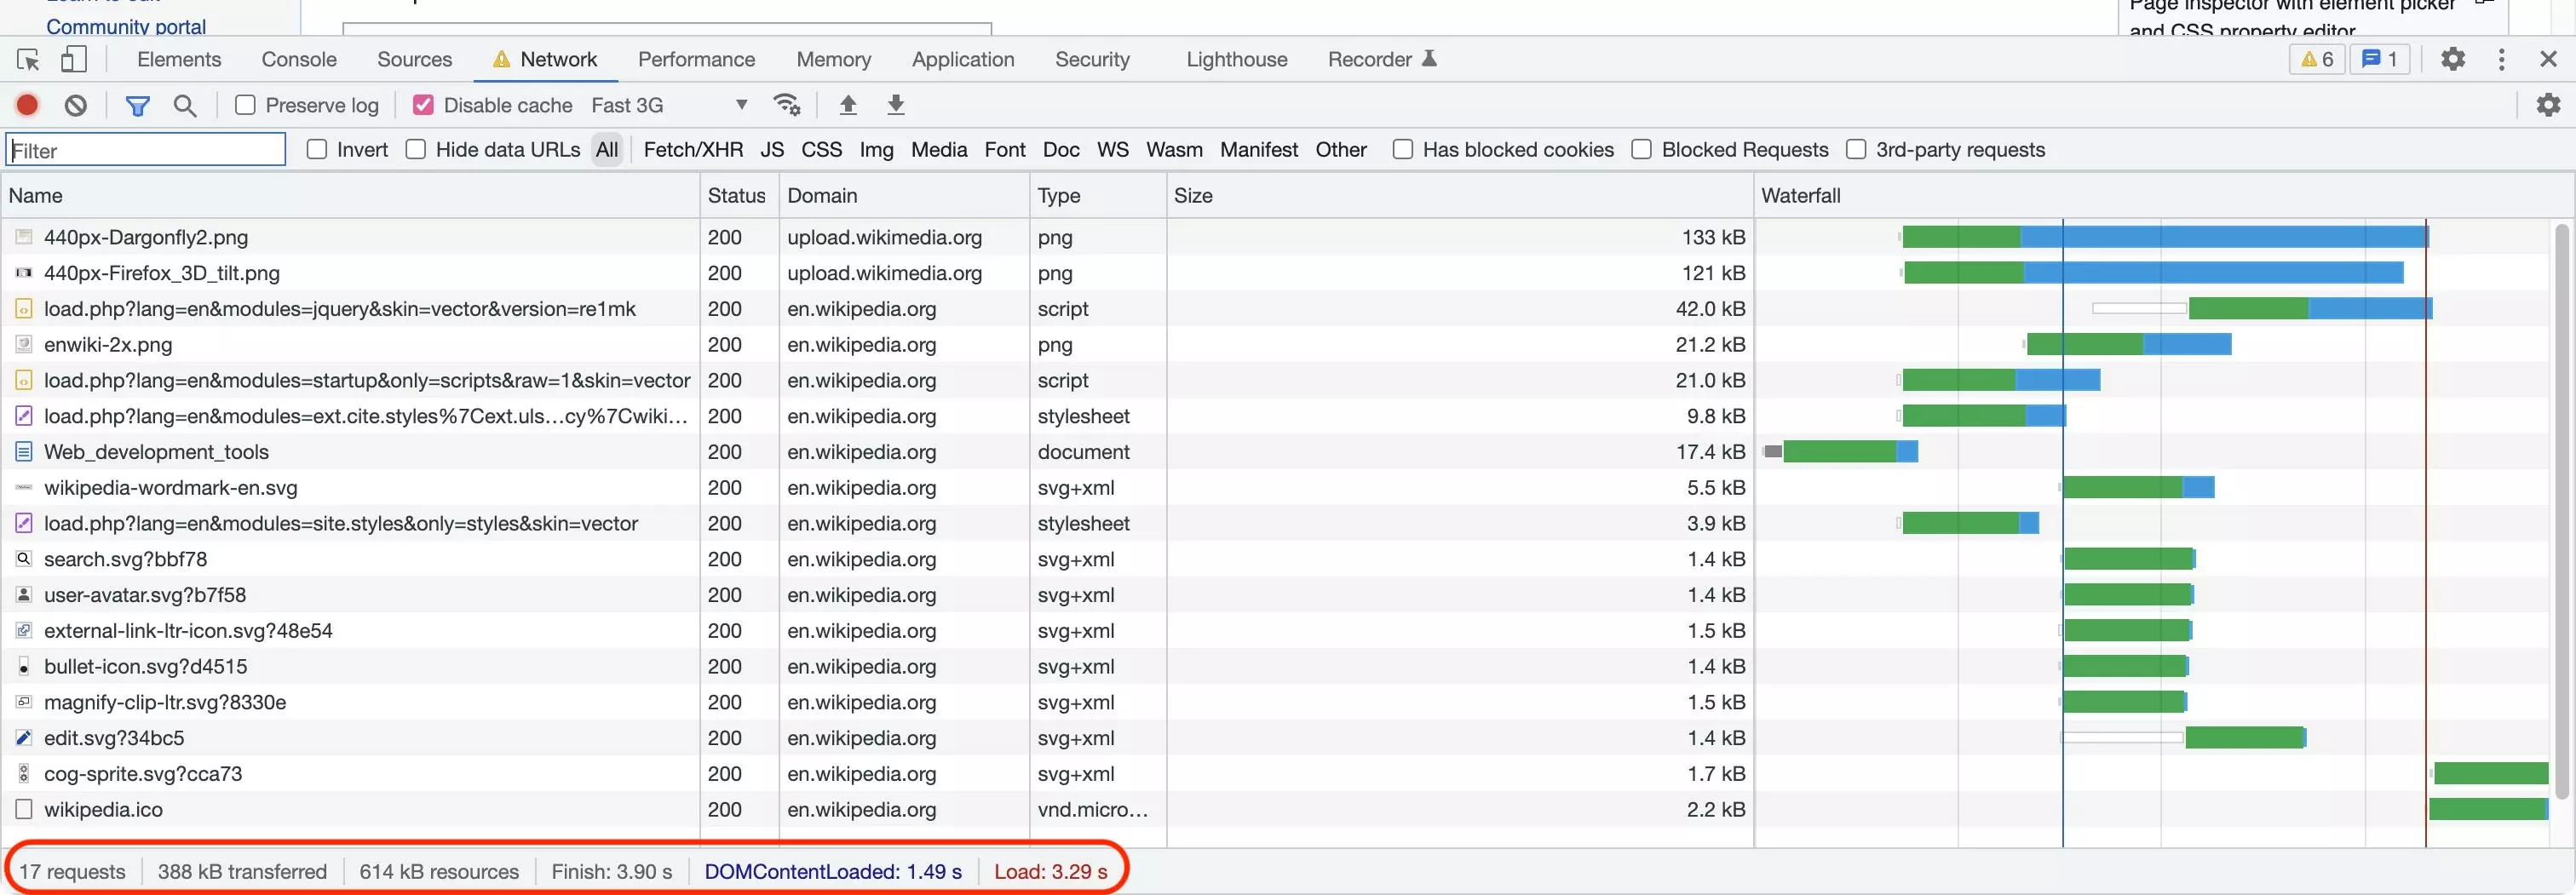
A page’s loading speed is a crucial factor for search engine ranking and user experience. We can use the network tab in Chrome Developer Tools to analyze resources as well as their size and load time:
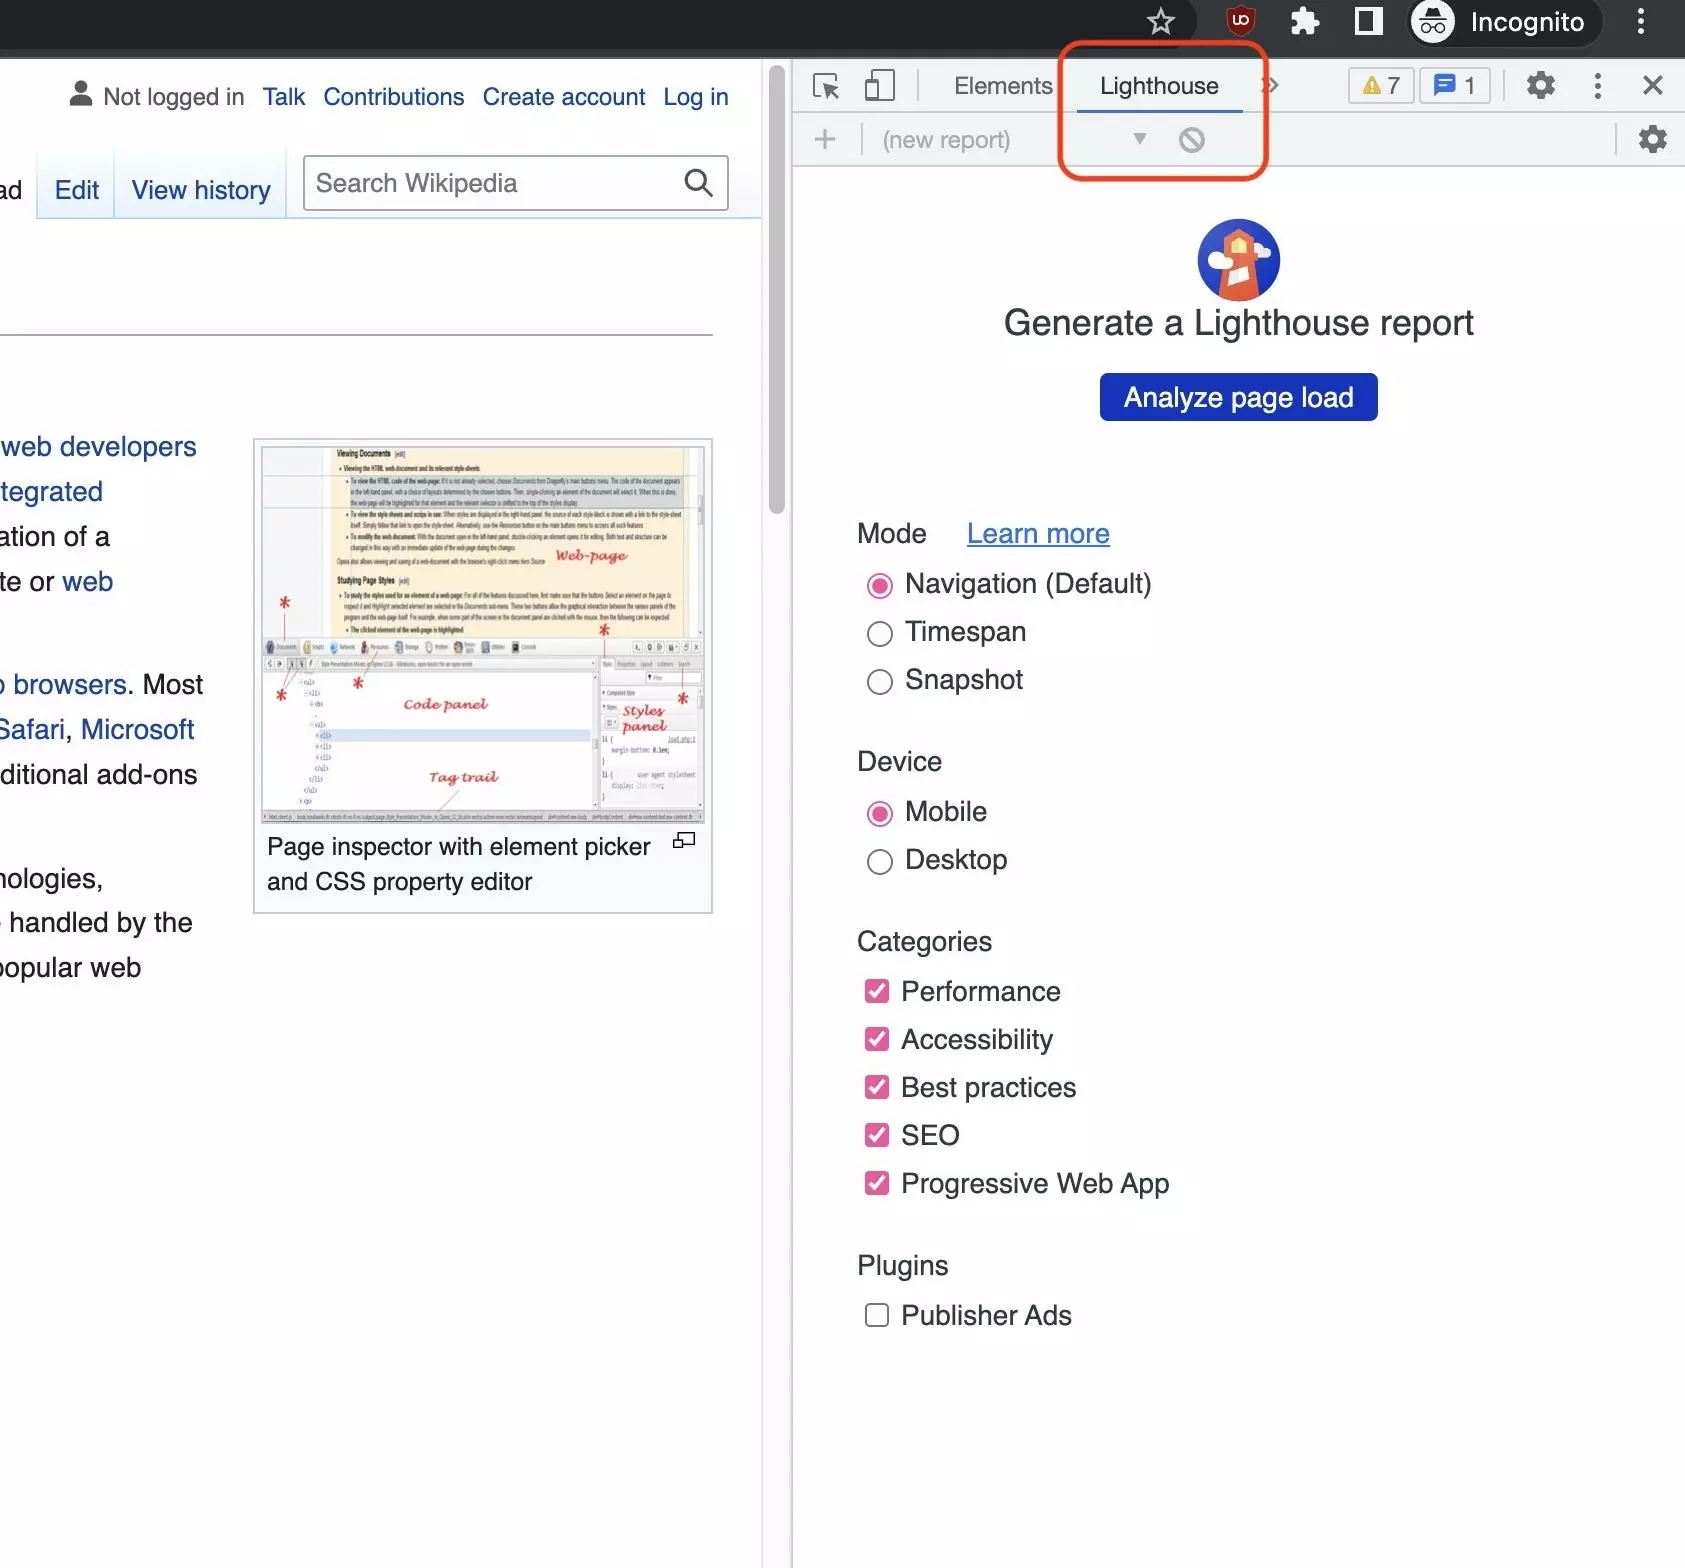
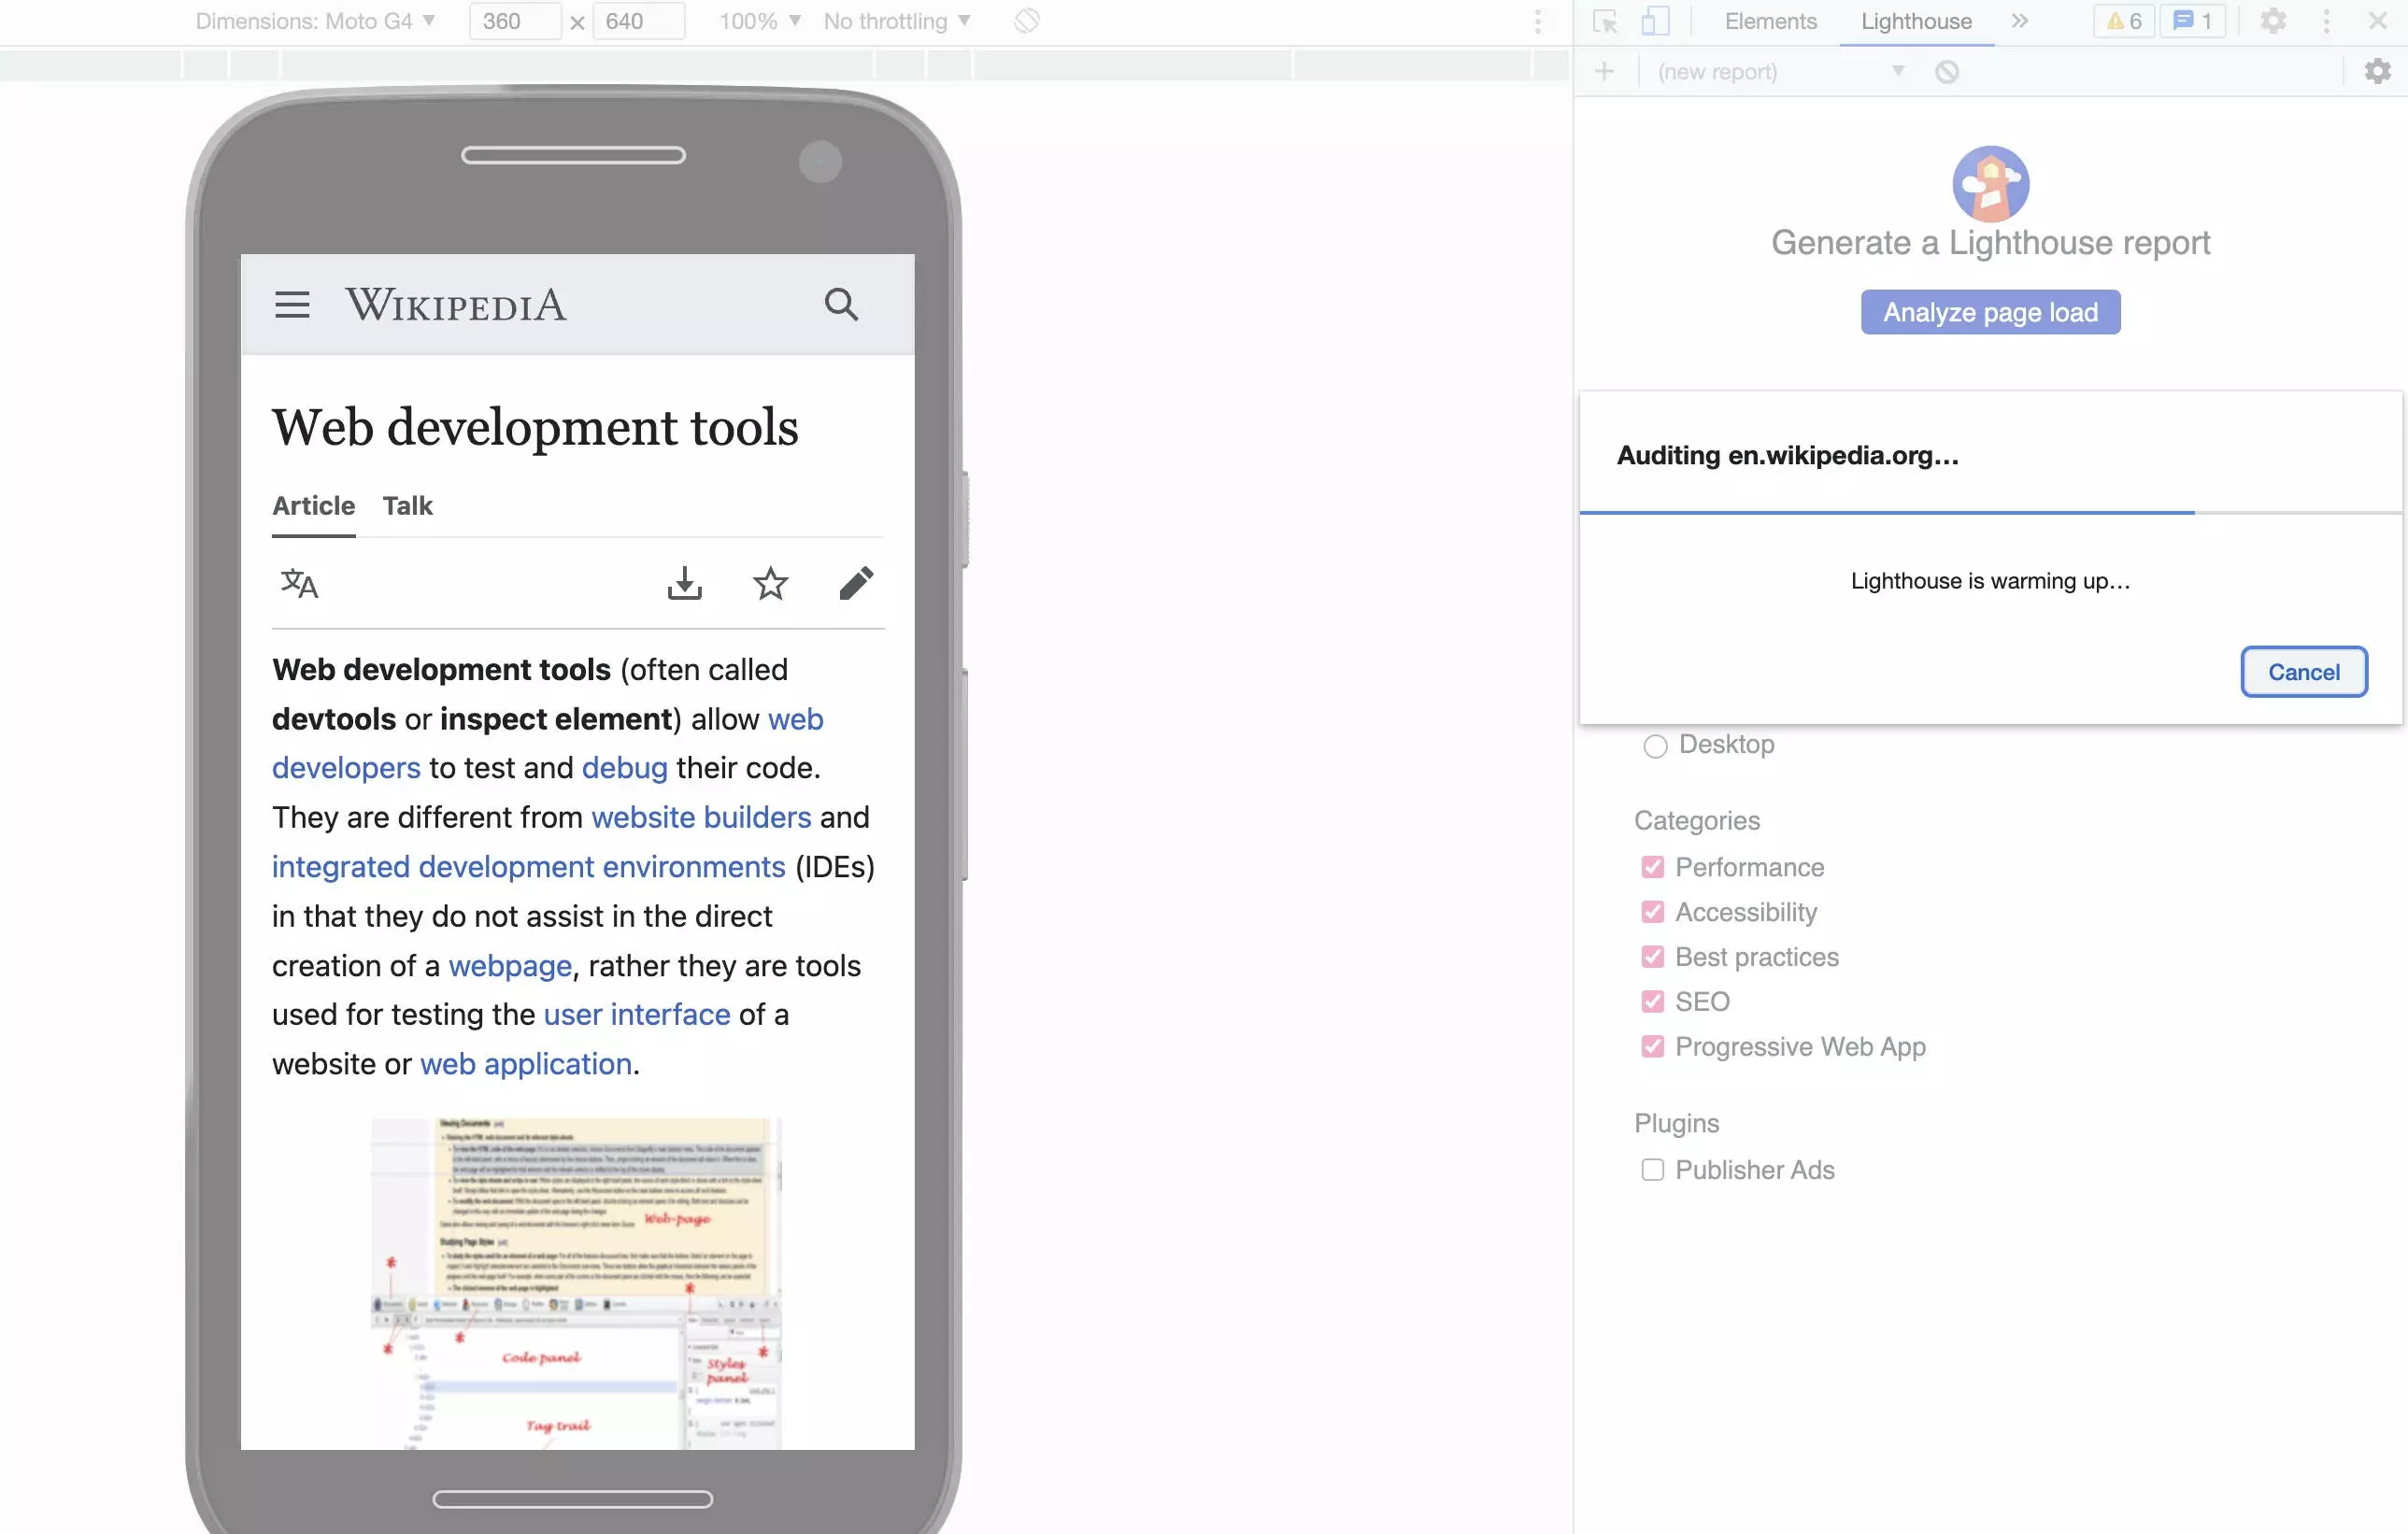
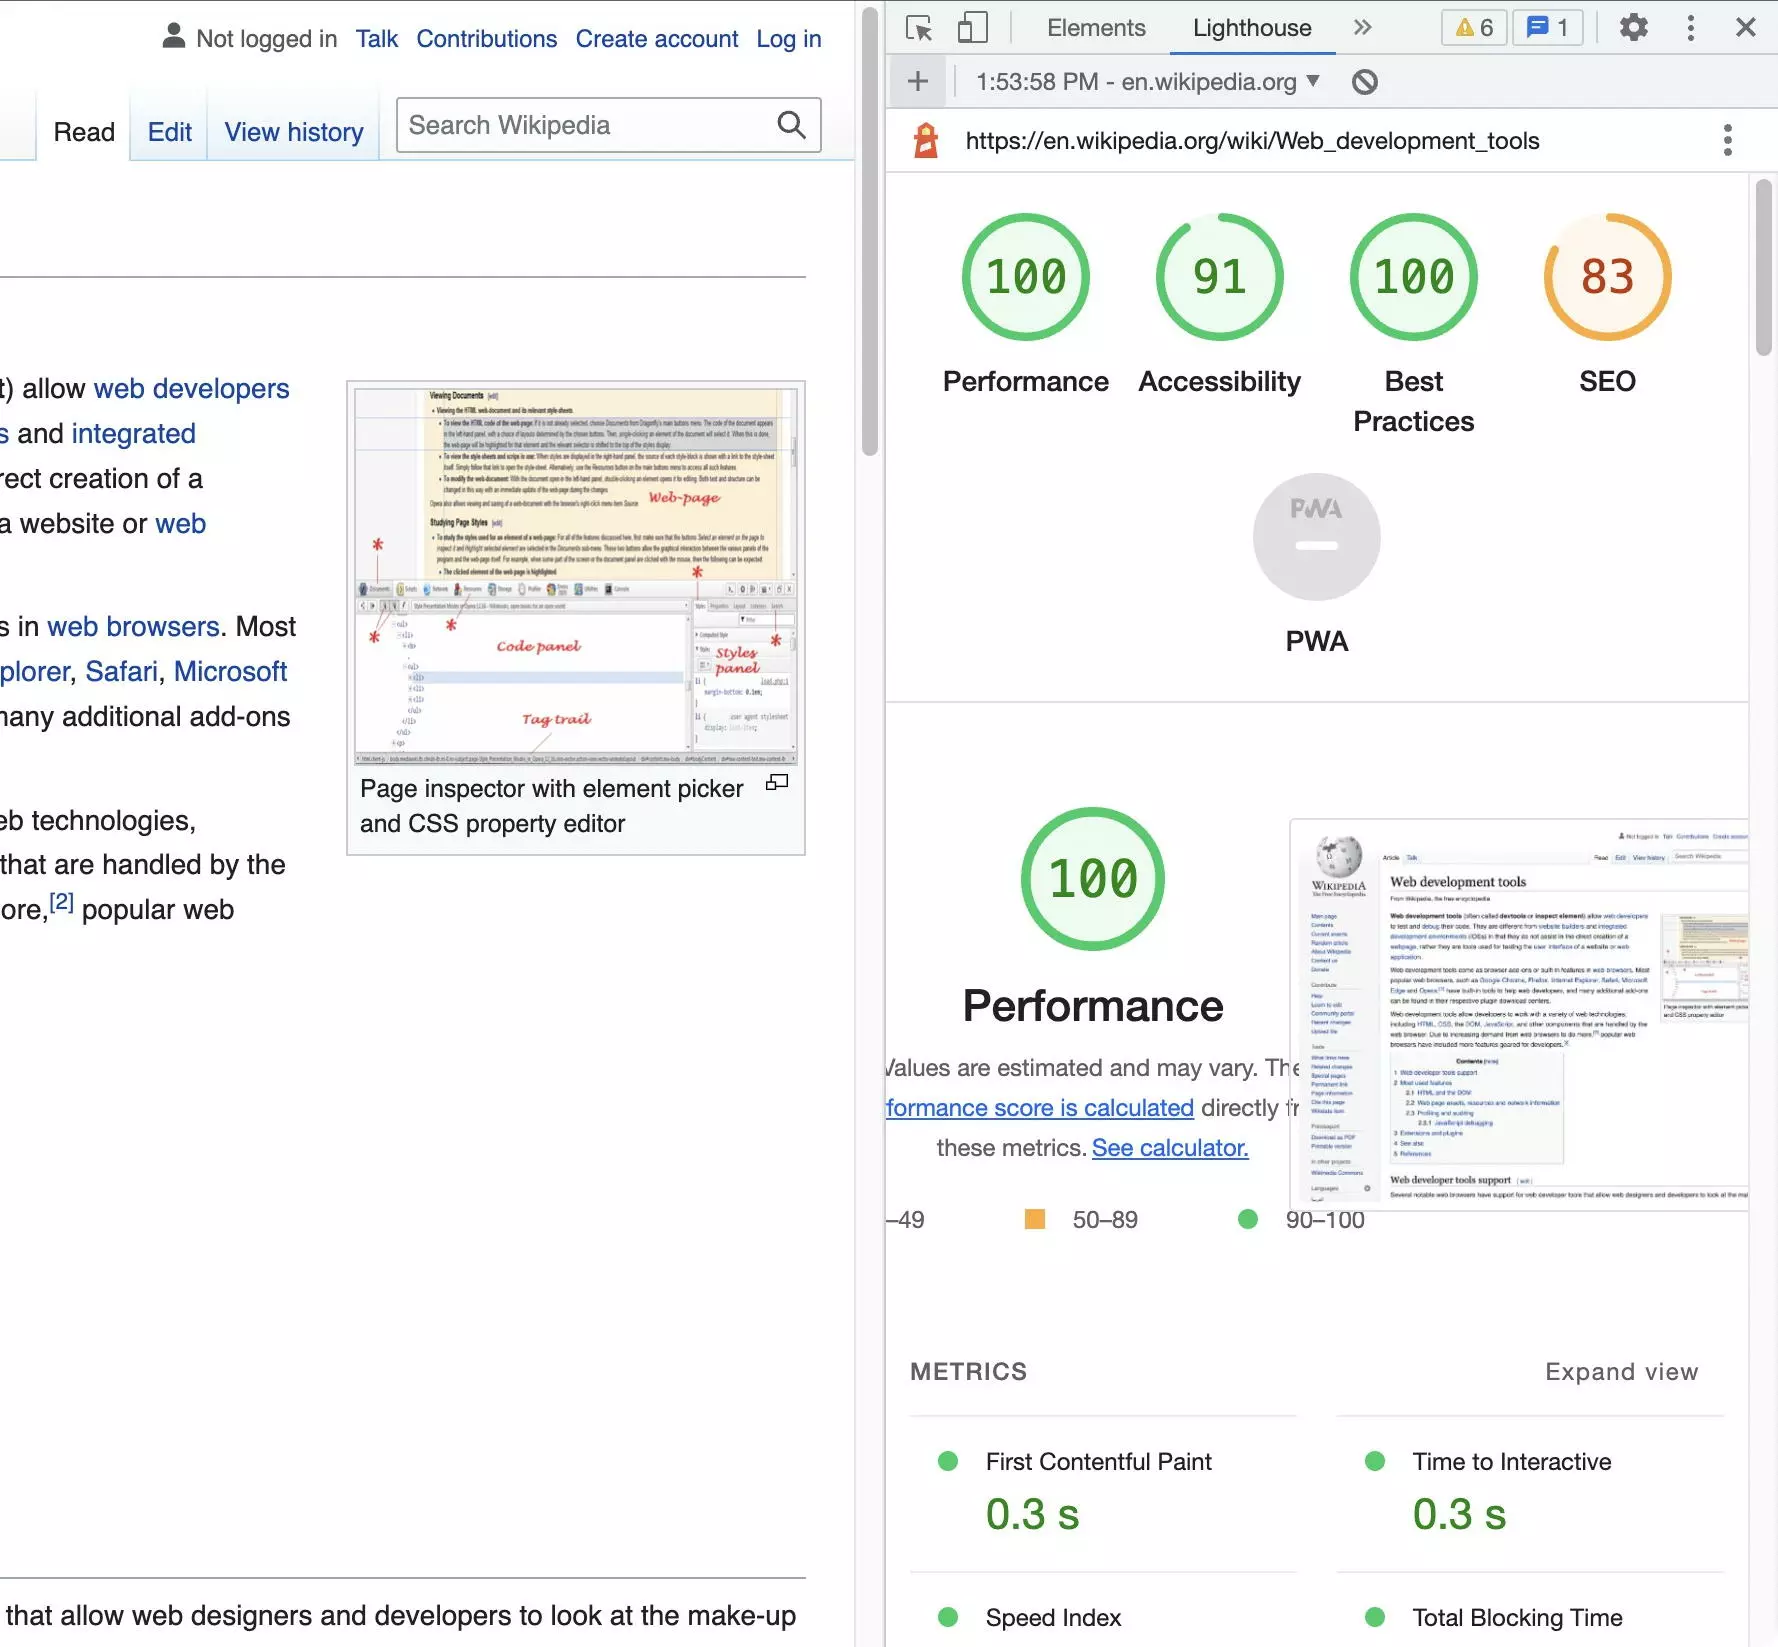
Included in Chrome DevTools is the Google tool Lighthouse, which can carry out multiple SEO-relevant audits of a page. The desktop and mobile versions of the page can be analyzed separately:
Adapt page
Alongside the professional uses we have already covered, Chrome Developer Tools can also be used to adapt websites displayed in a browser. This is particularly useful to print pages or prepare screenshots. One of the most used tricks is to find and hide certain elements with “inspect element”. This allows you to get rid of annoying ads or cookie banners.
The easiest way to do this is to give the element that you want to hide the following CCS property:
display: none;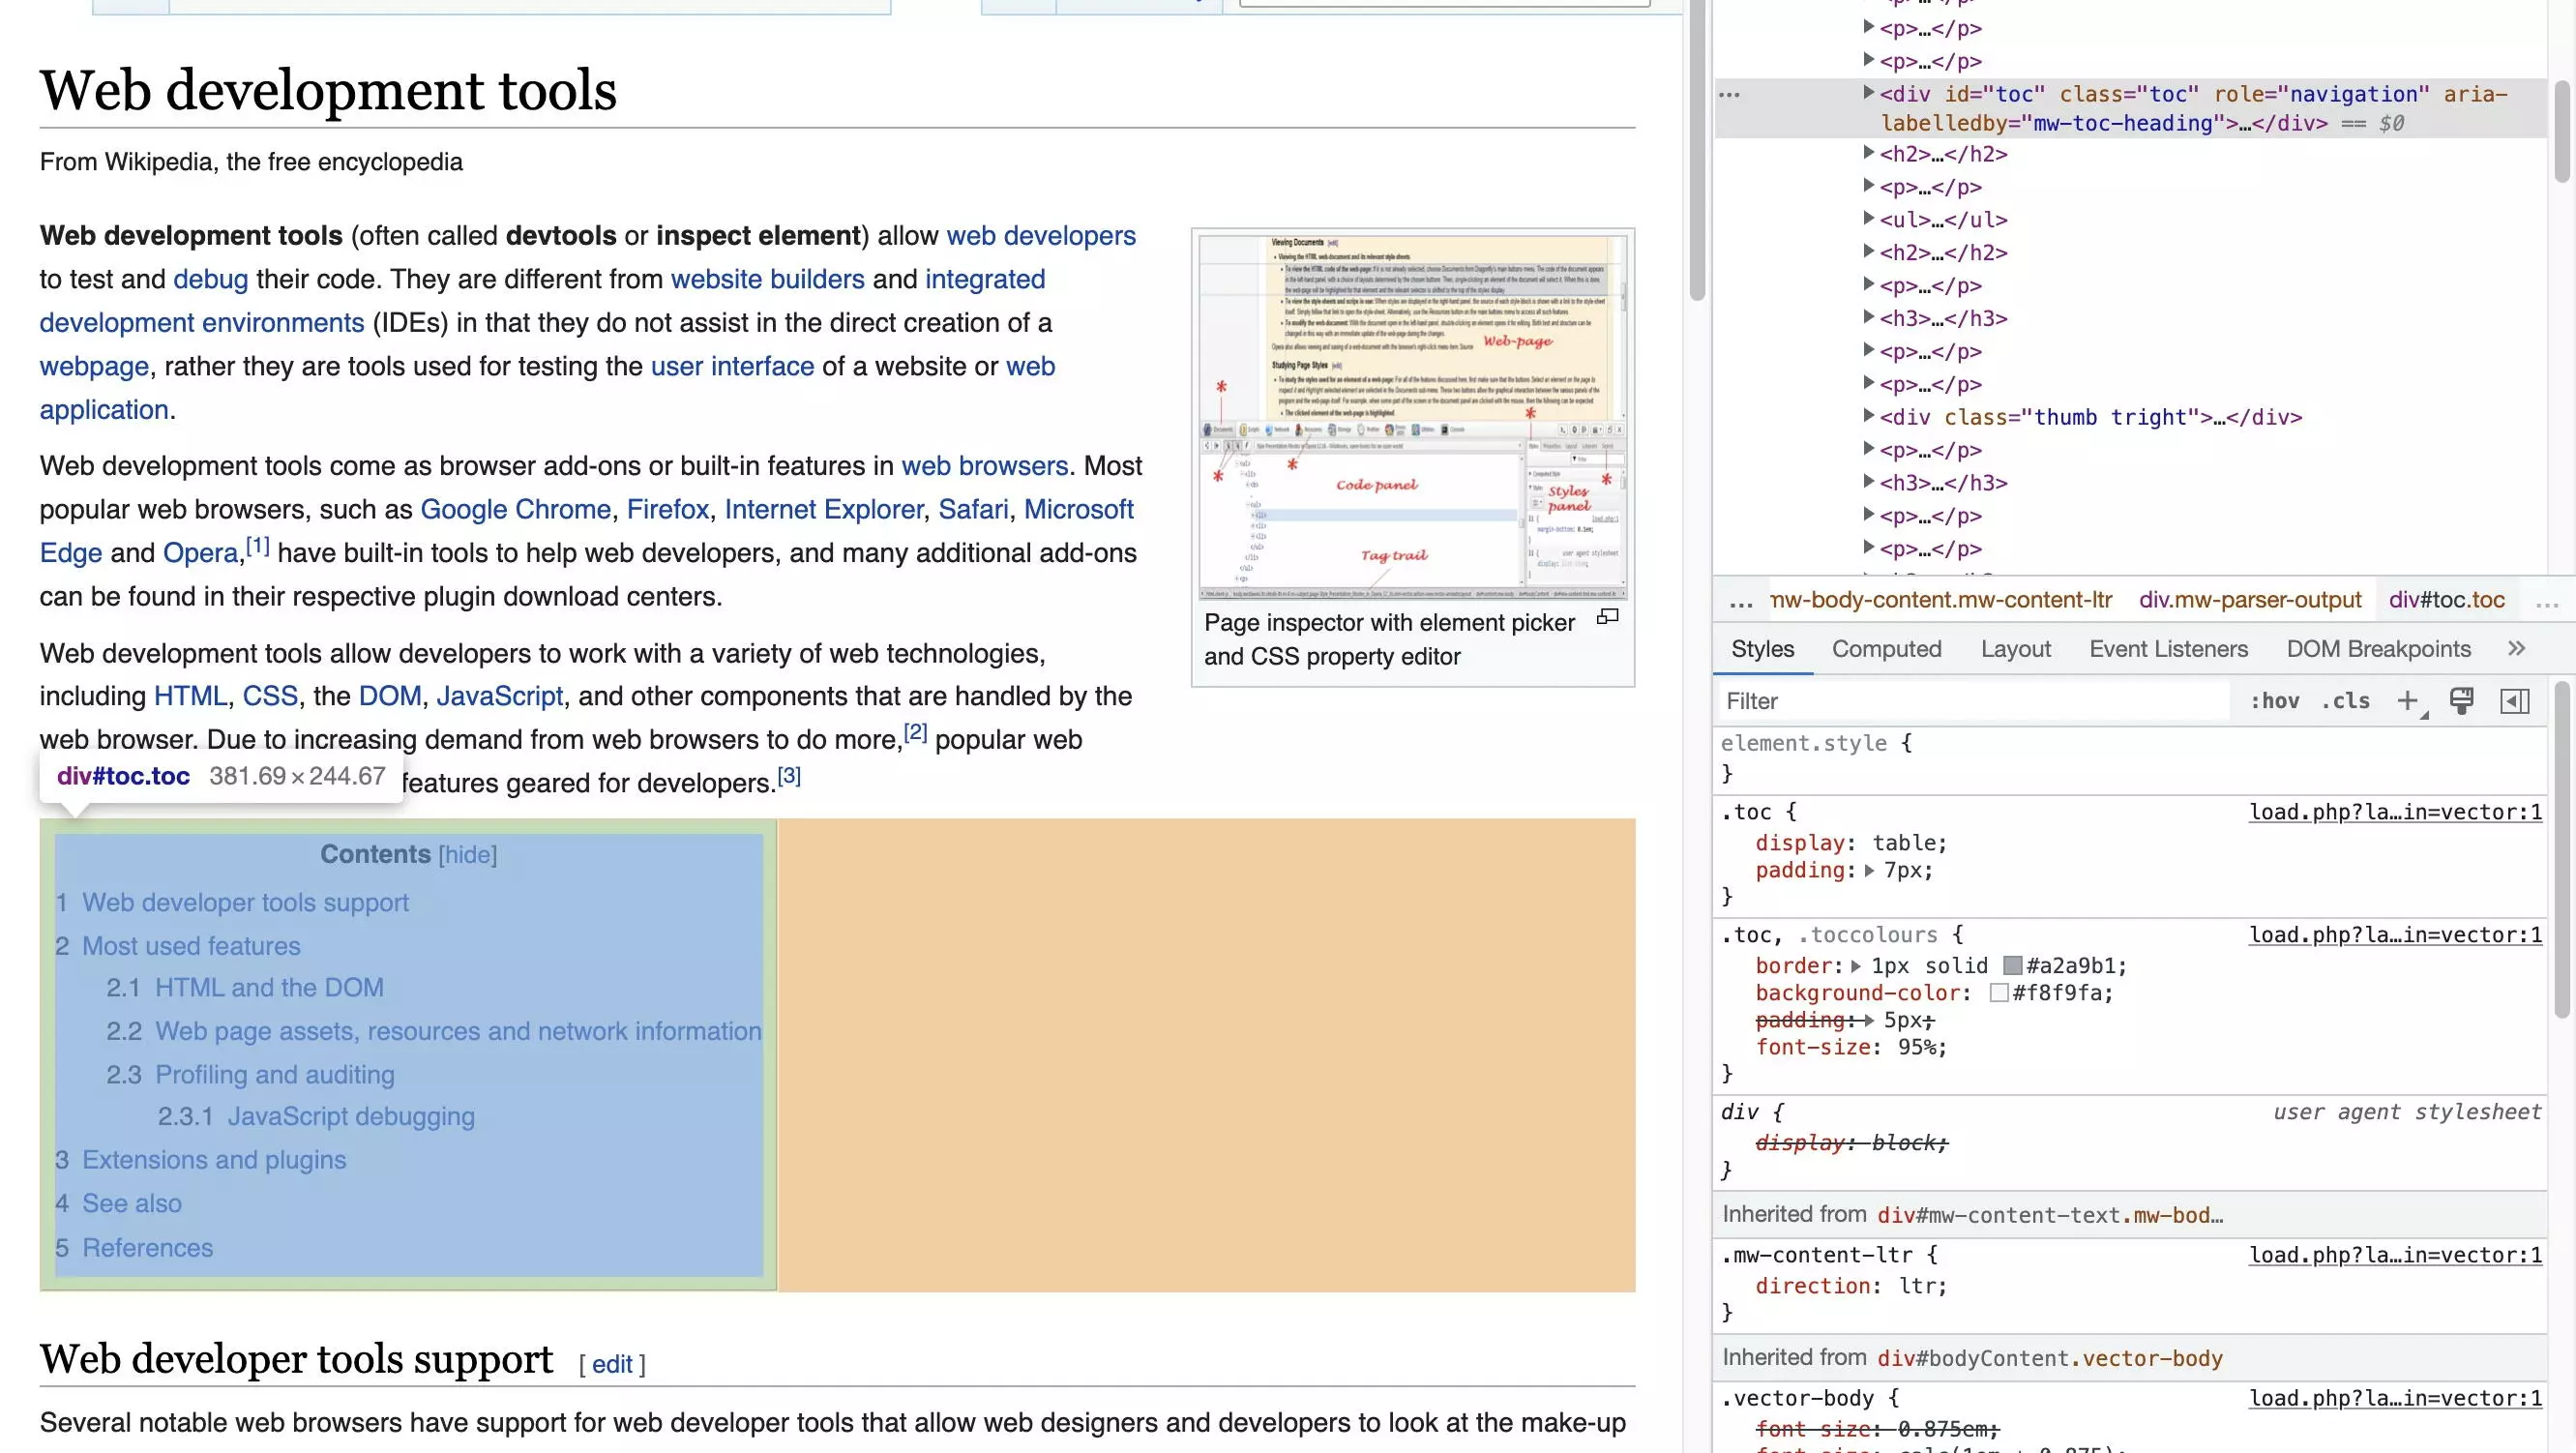
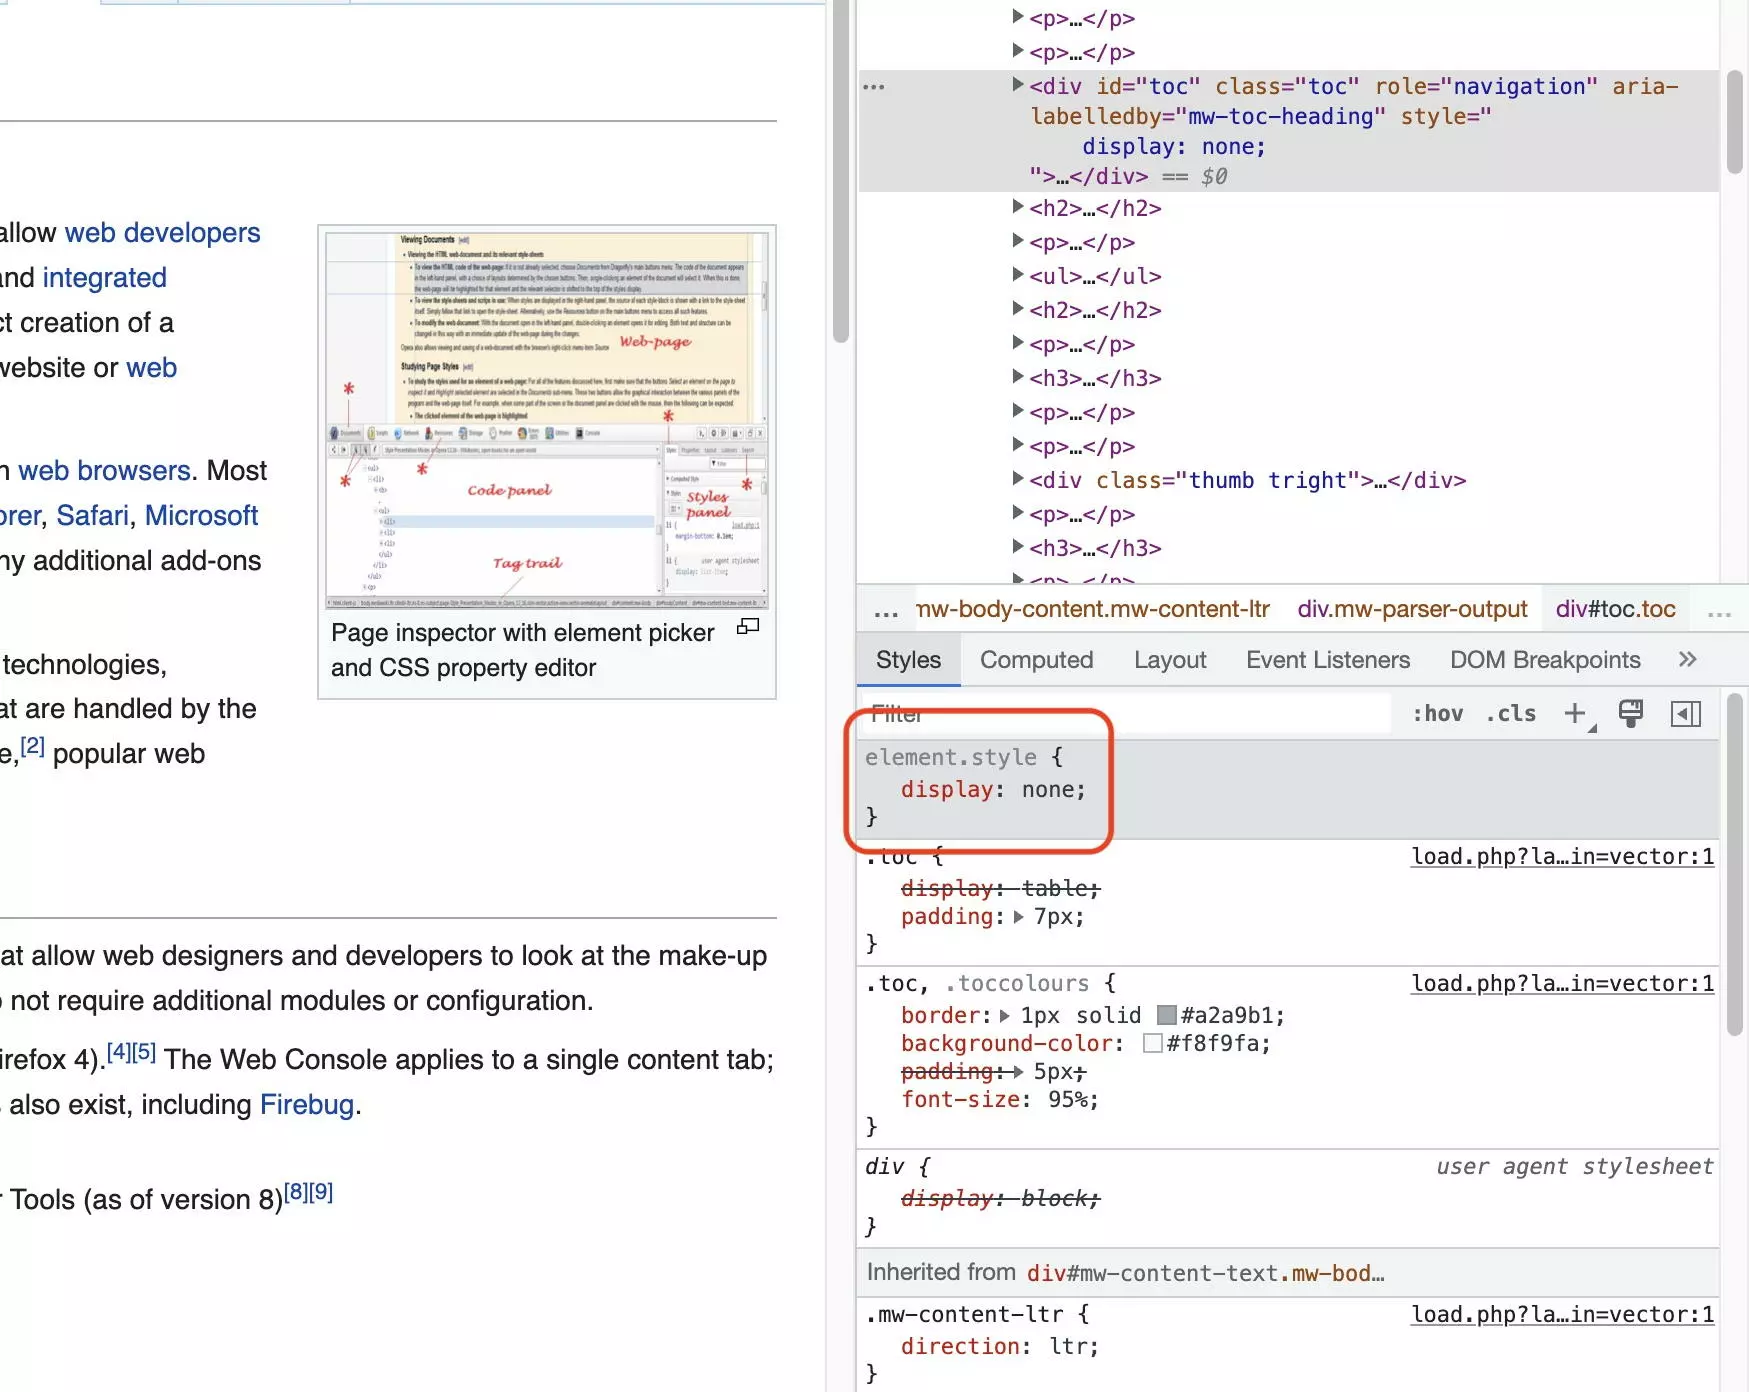
To undo a DOM change, you can use the undo shortcuts Ctrl+Z (Windows + Linux) or Cmd+Z (Mac). Alternatively, you can reload the page, causing all local changes to the DOM to be removed.
As a further alternative, you can select the element you want to hide with “inspect element” and use JavaScript to assign it the CCS property. To do this, use the interactive version of “inspect element”:
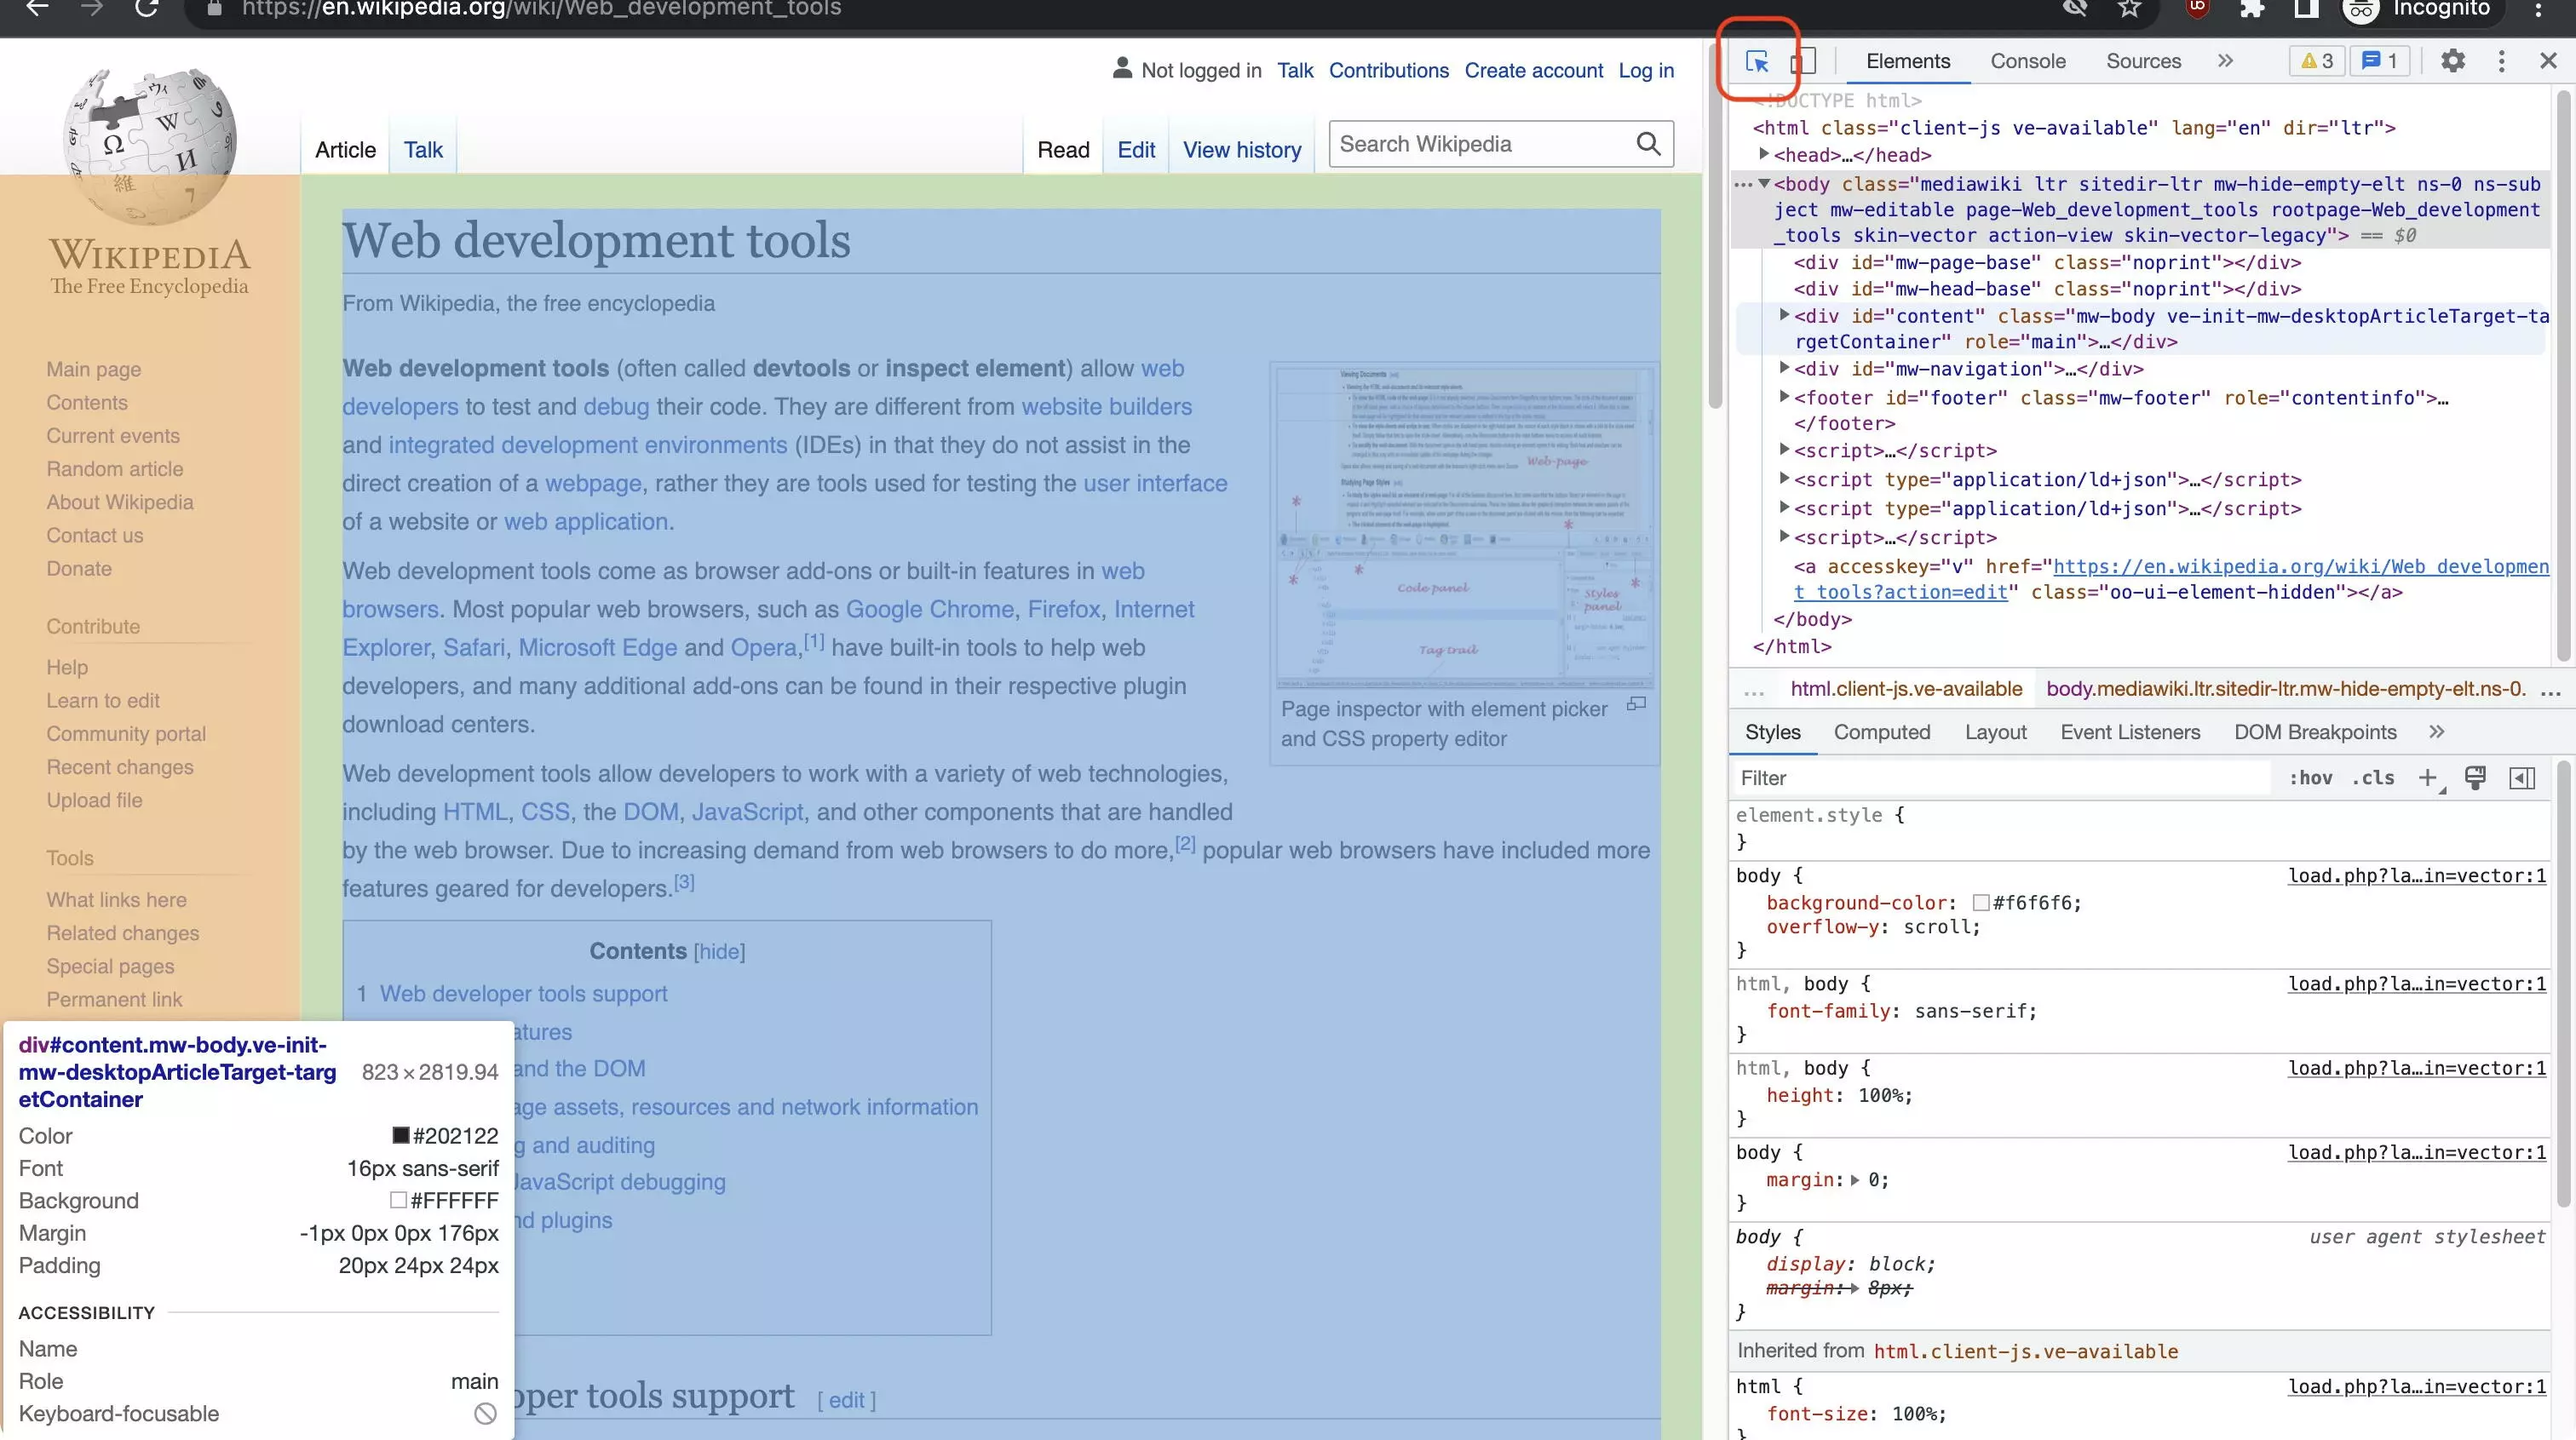
# hide inspected element
$0.style.display = 'none'
# undo changes to inspected element
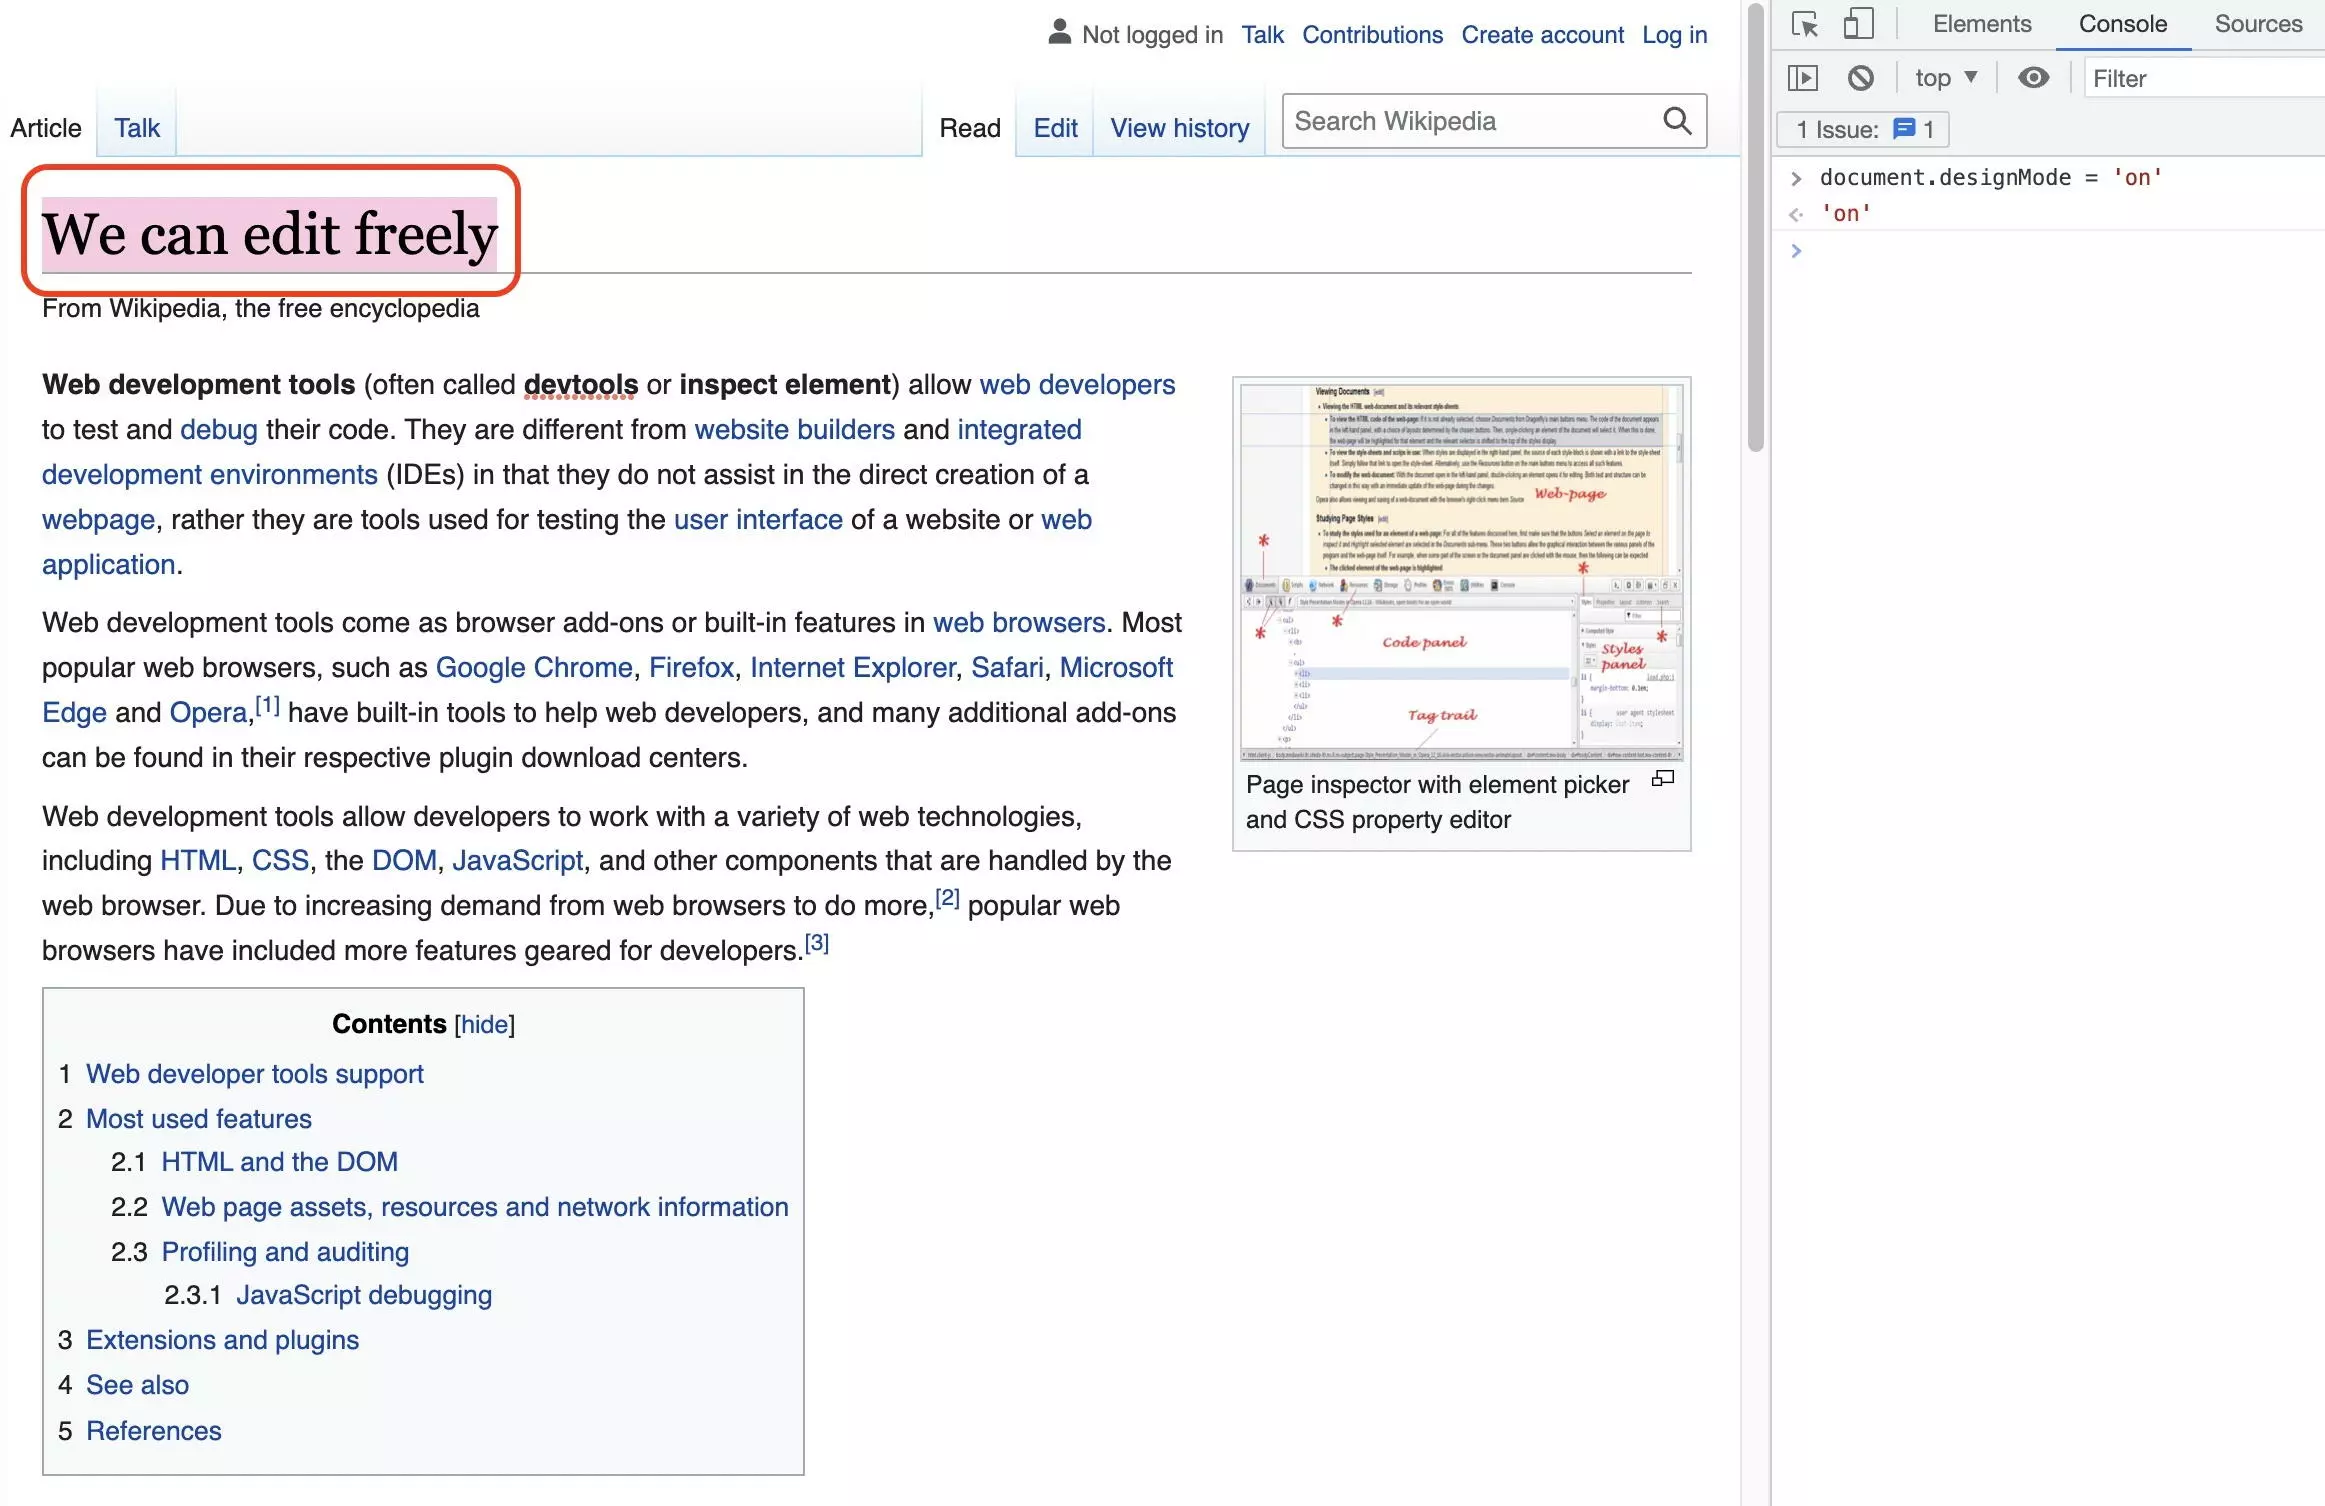
$0.style.display = 'revert'When using JavaScript, you can also activate design mode. This allows you to edit the text on the page as you would in Word:
document.designMode = "on"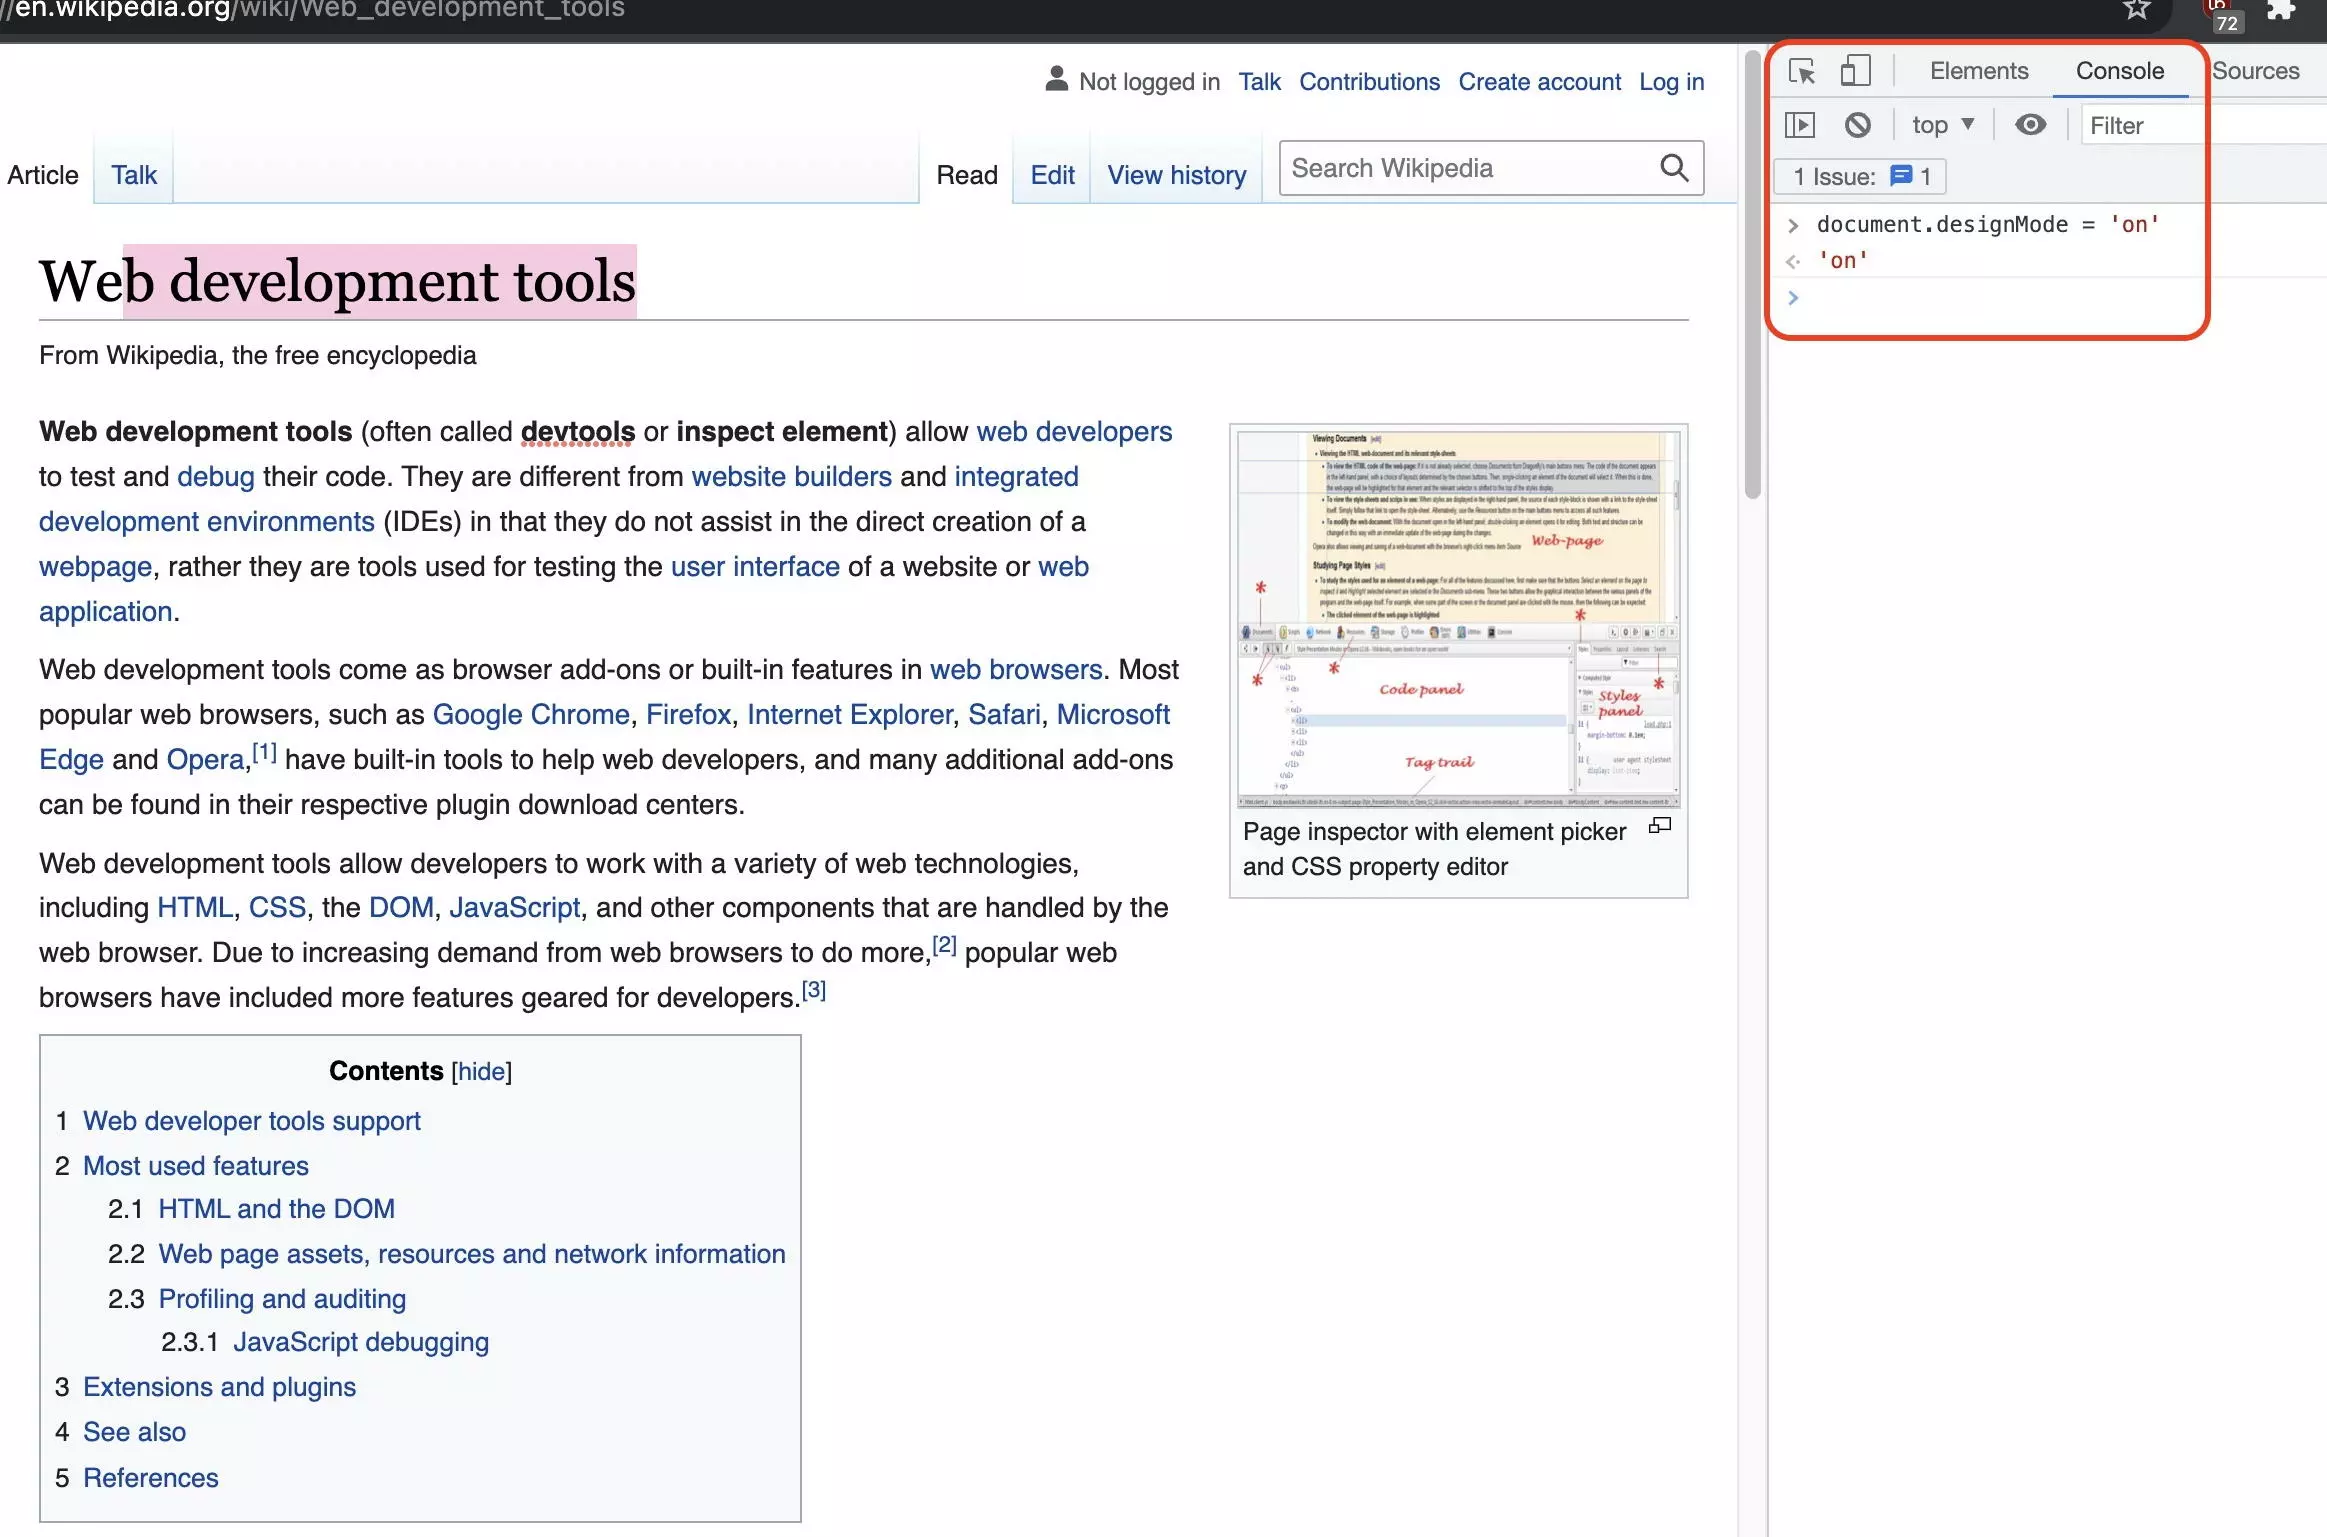
Extracting content
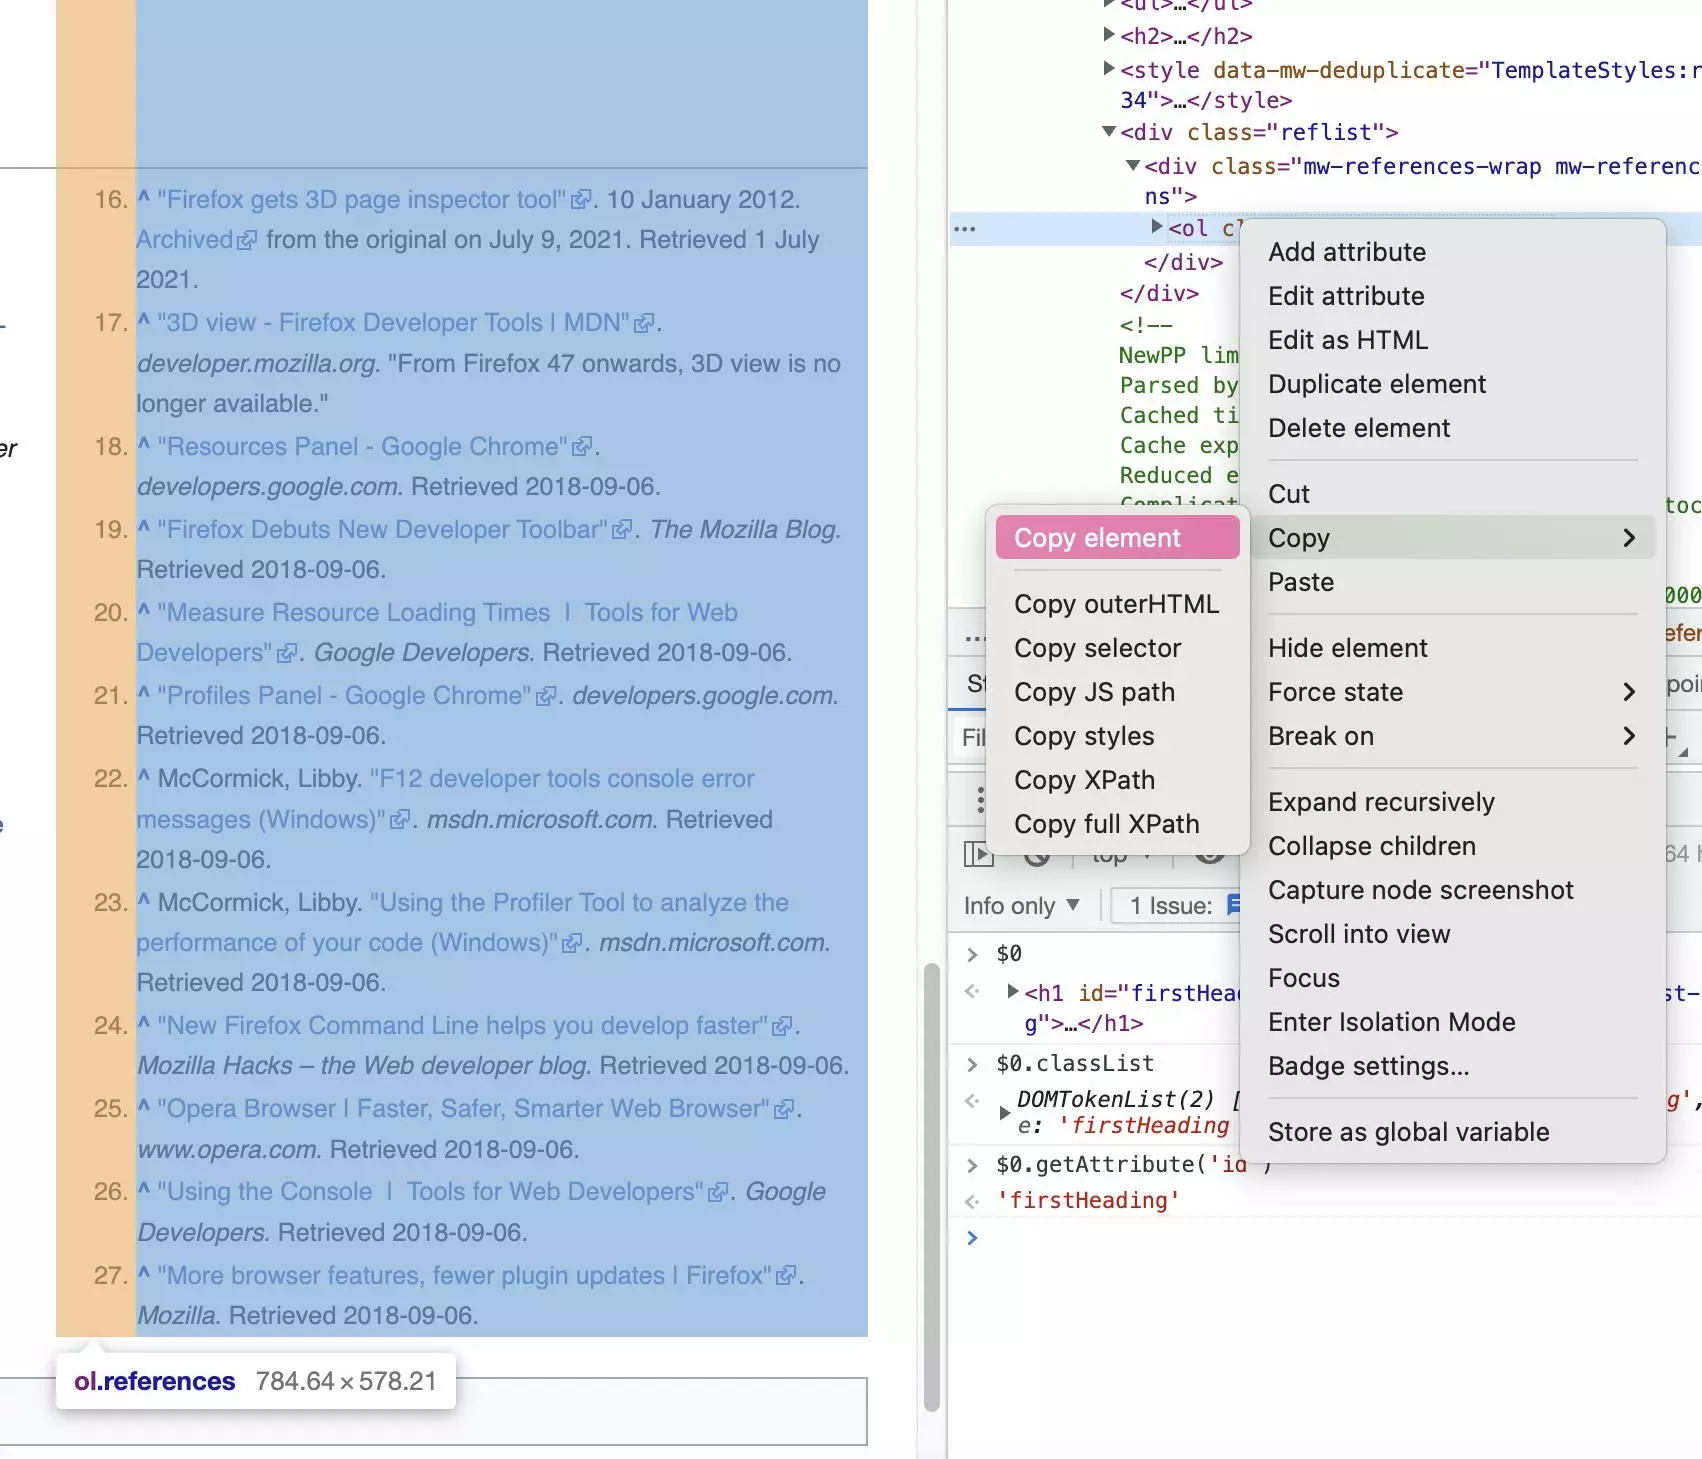
Websites contain a lot of helpful content, most of which users can easily access. It only takes a couple of clicks to copy texts or download images. Sometimes, this isn’t enough though. For example, let’s say you want to extract a complete list or table with information. In addition to exporting the content and structure of an element, the ‘copy element’ feature allows you to export sub-elements as well. You can then edit these in code editors. Chrome DevTools can also be used to fill Google tables with ImportXML.
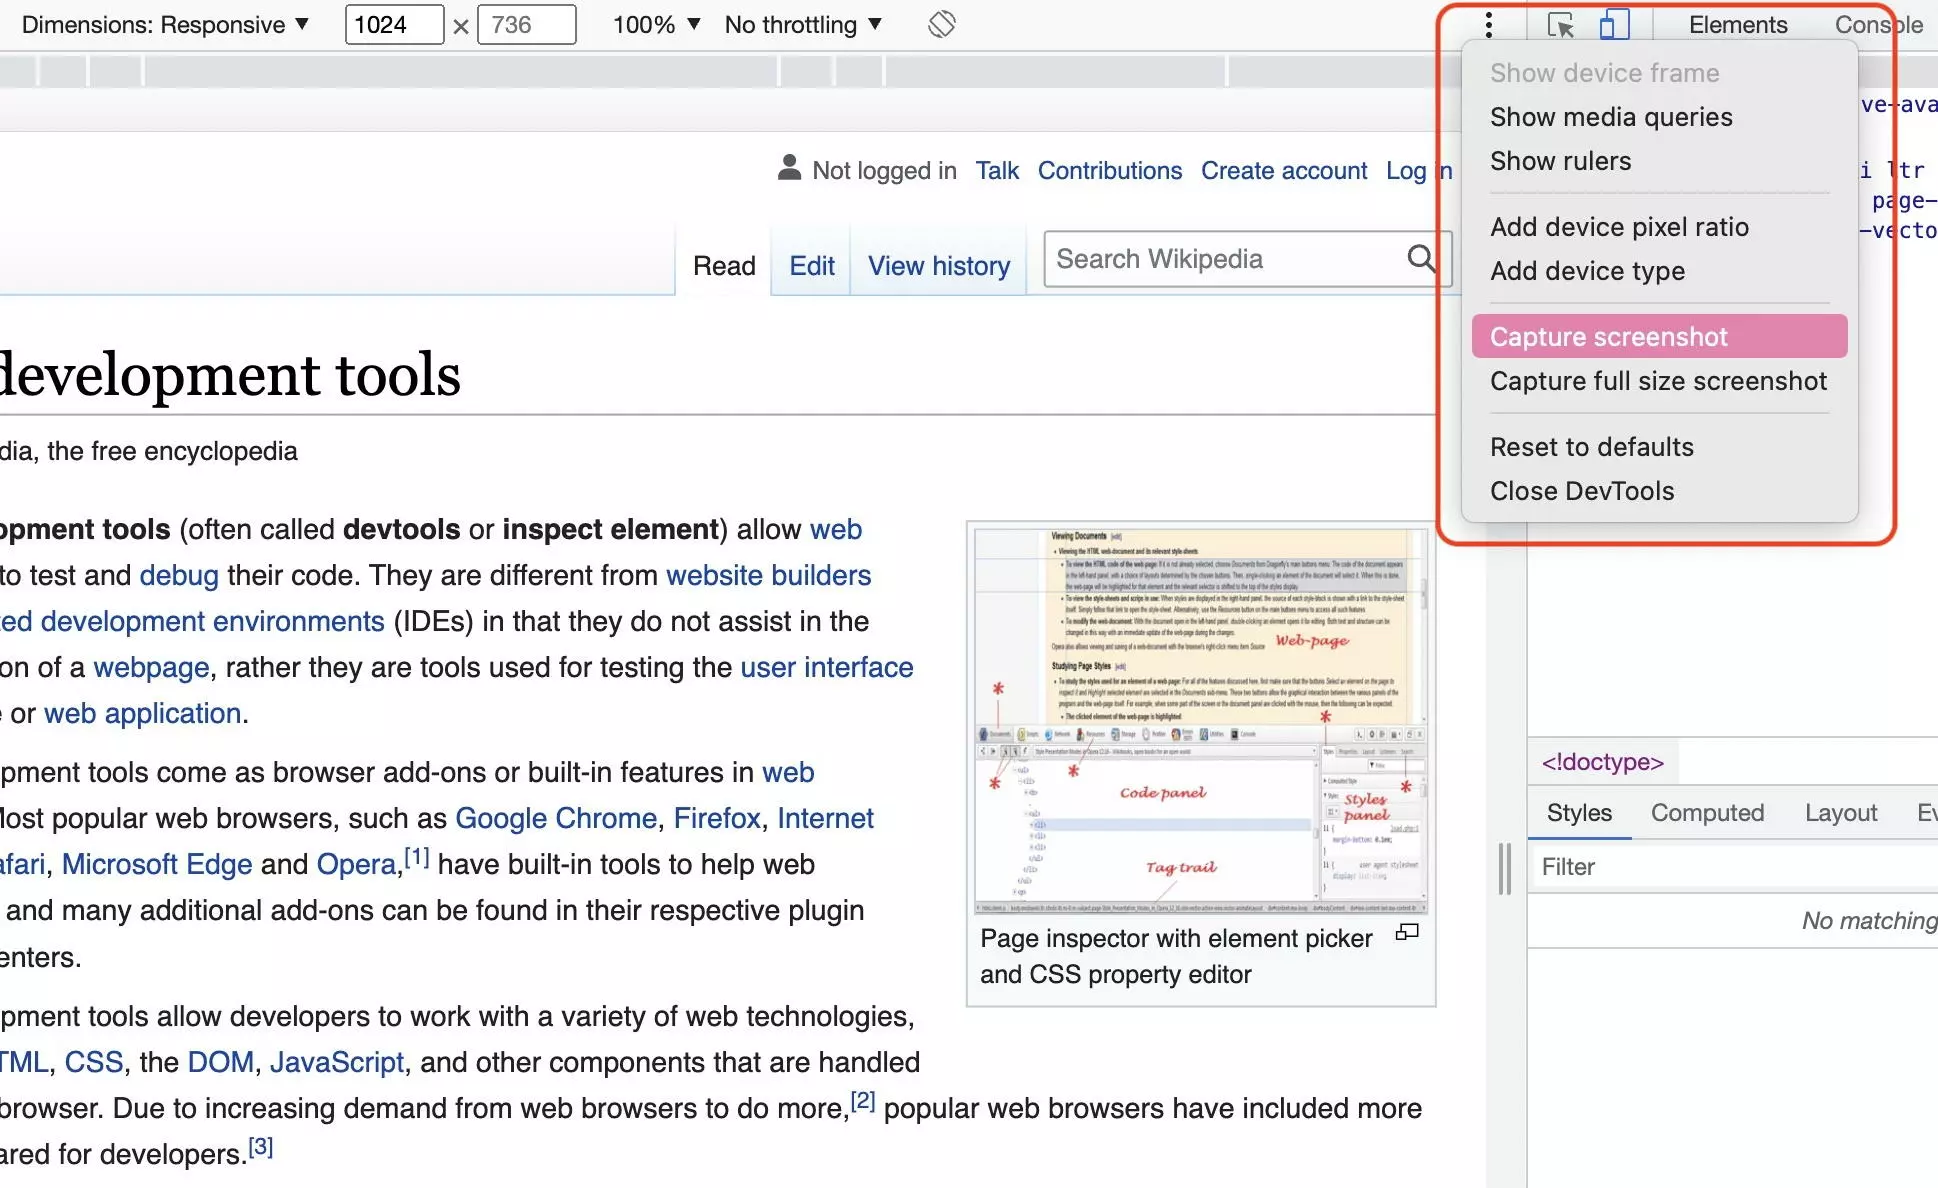
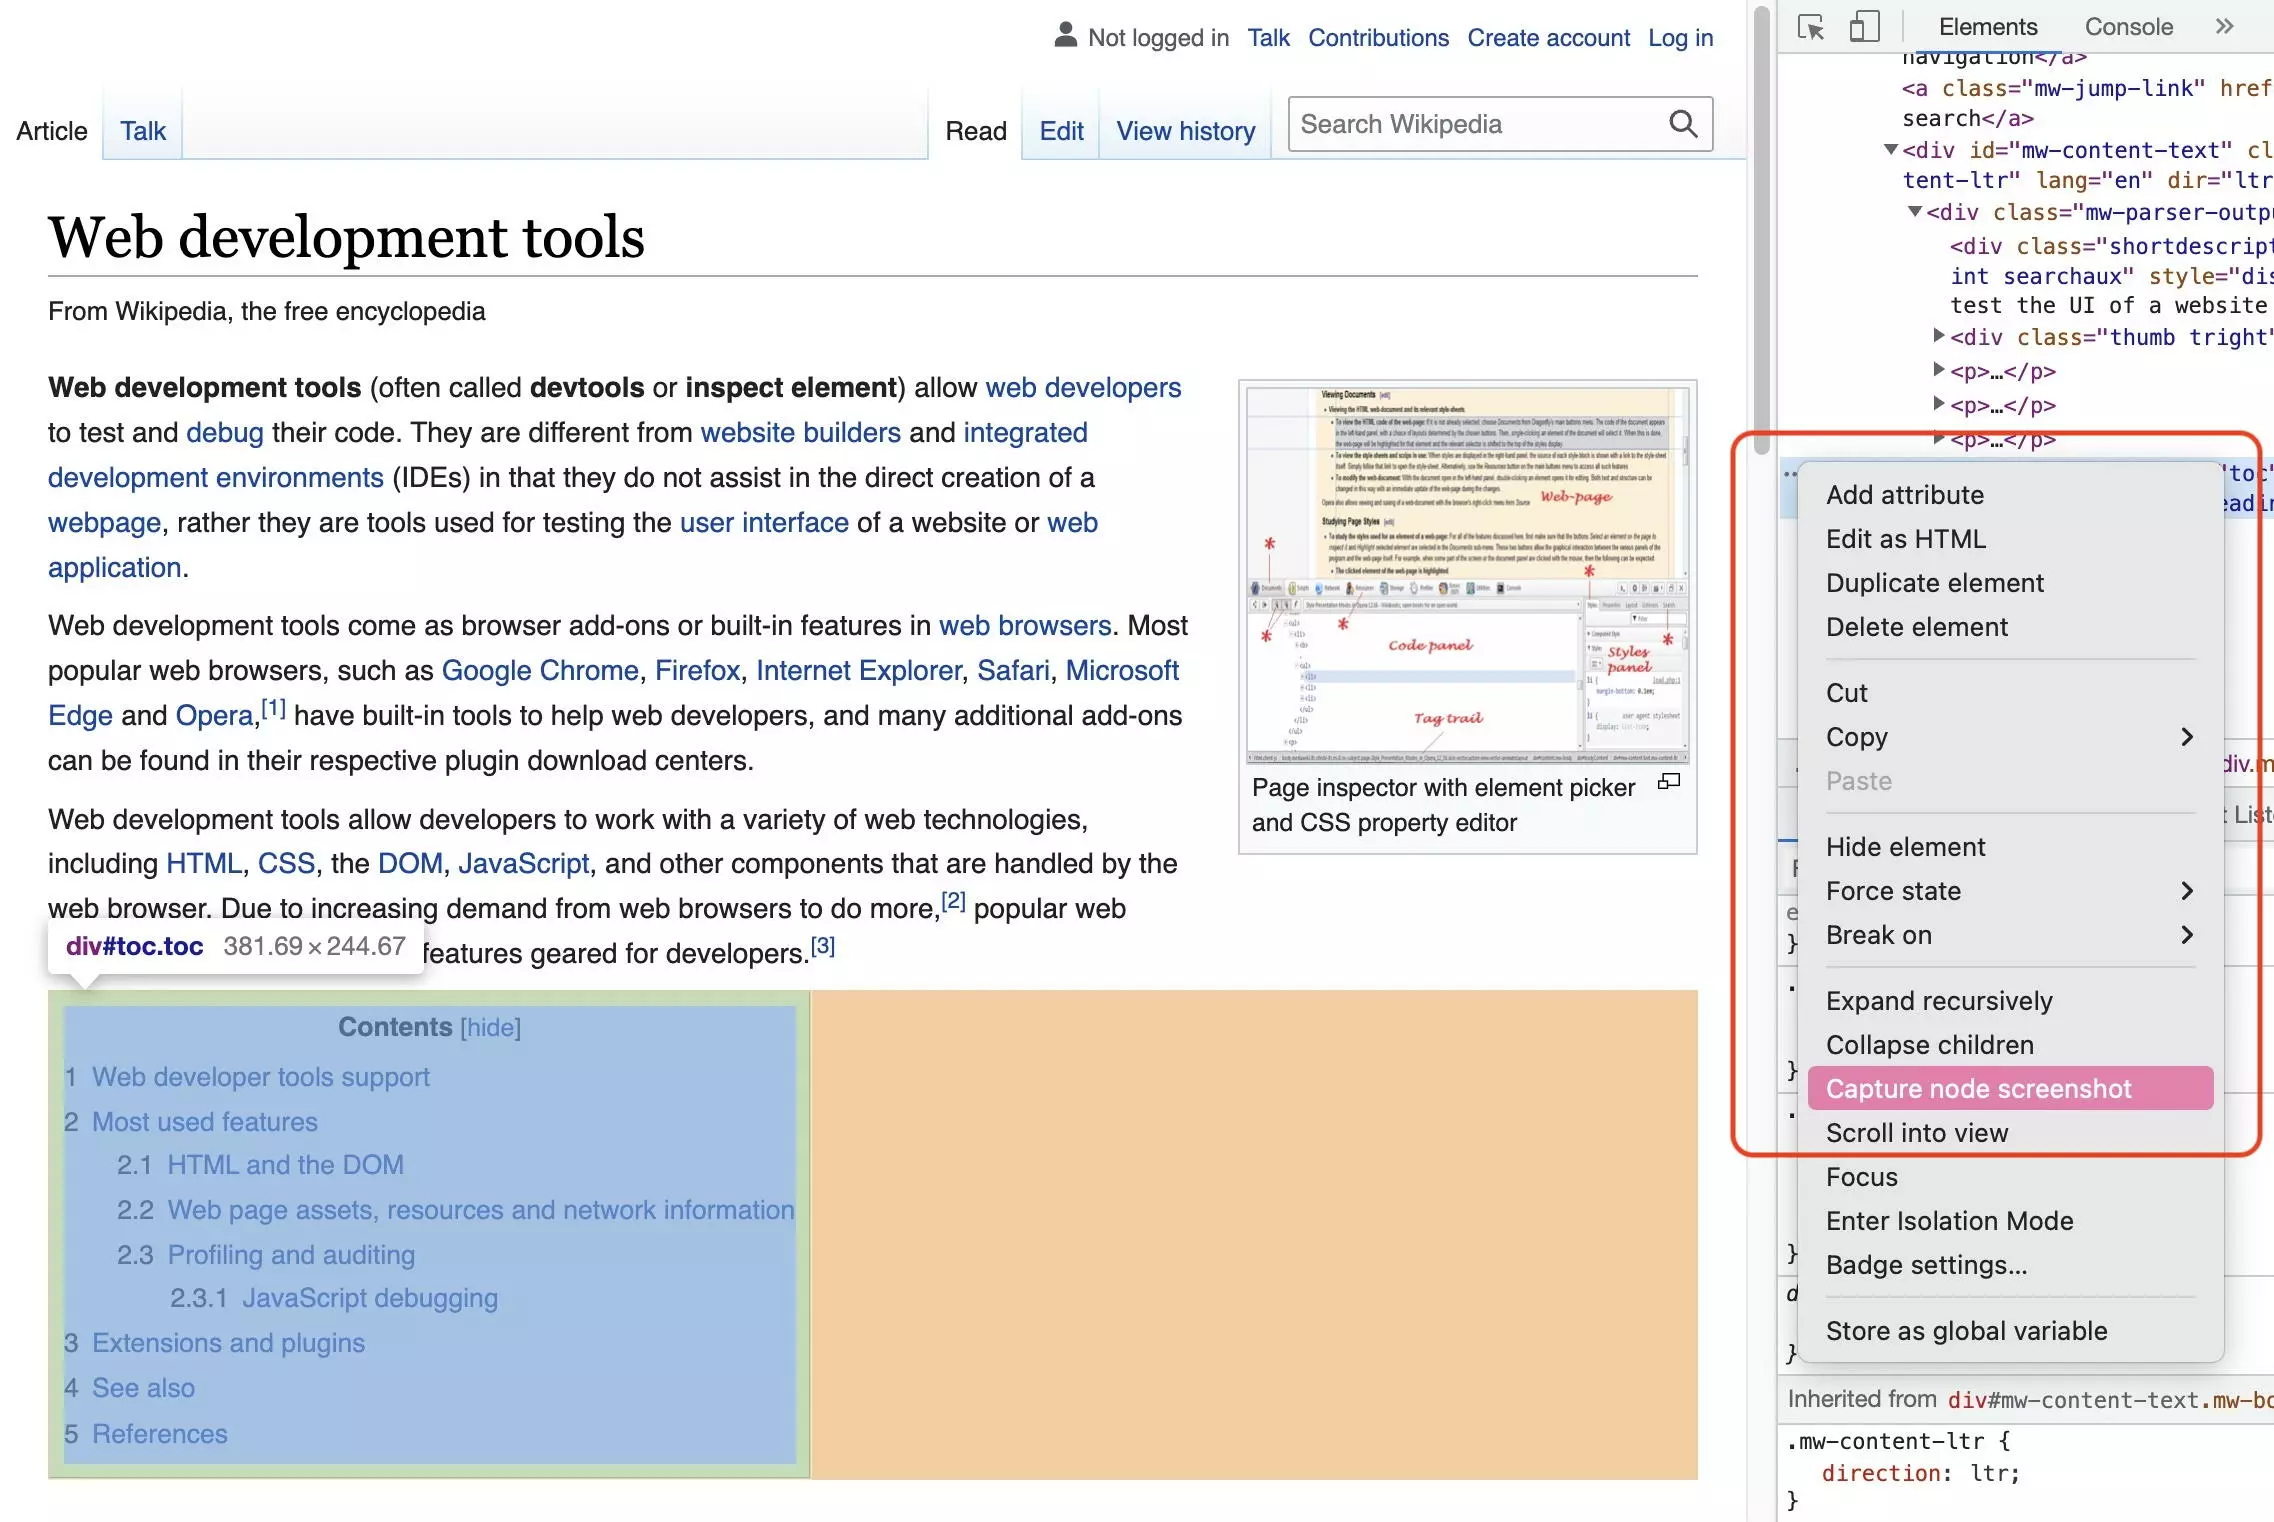
Chrome DevTools also allows you to take screenshots. This allows individual elements, the viewport or the entire page to be exported as an image. In combination with responsive mode, you can show the display on different devices.
Chrome DevTools and its “inspect element” function are essential for the modern workflows of web professionals. It’s well worth learning how to use this set of web developer tools.


