Google PageSpeed Insights: how fast is your site?
Websites that take a long time to load are not appreciated by users or even by Google itself. The loading speed of a website has been an important ranking factor for Google since 2018. Slow pages, whether on desktop or mobile, are punished by the algorithm. Pages that take more than two seconds to load are completely ignored by crawlers! And what’s more, 32% of users will abandon a website if it takes more than three seconds to load.
To this end, Google added a tool to its workbench, Google PageSpeed Insights, that helps to analyze the loading time of a website and, if necessary, optimize it.
What does Google PageSpeed Insights measure?
PageSpeed Insights is a Google SEO tool whose primary function is to measure and analyze the loading time of a URL. To do this, simply enter the web address into the field and set it running. The result, i.e., the “insight into the page speed”, is broken down and displayed for both mobile and desktop versions. You can switch from one view to the other easily. Every valid URL can be analyzed with the tool.
Real user experiences taken from the Chrome User Experience Report (or CrUX for short) are also considered. Google gets this data from users who have Google’s own browser, Chrome, and who voluntarily share their user statistics.
Data from Google Lighthouse is also included in the analysis. The tool evaluates the access to and performance, and user-friendliness of the selected website.
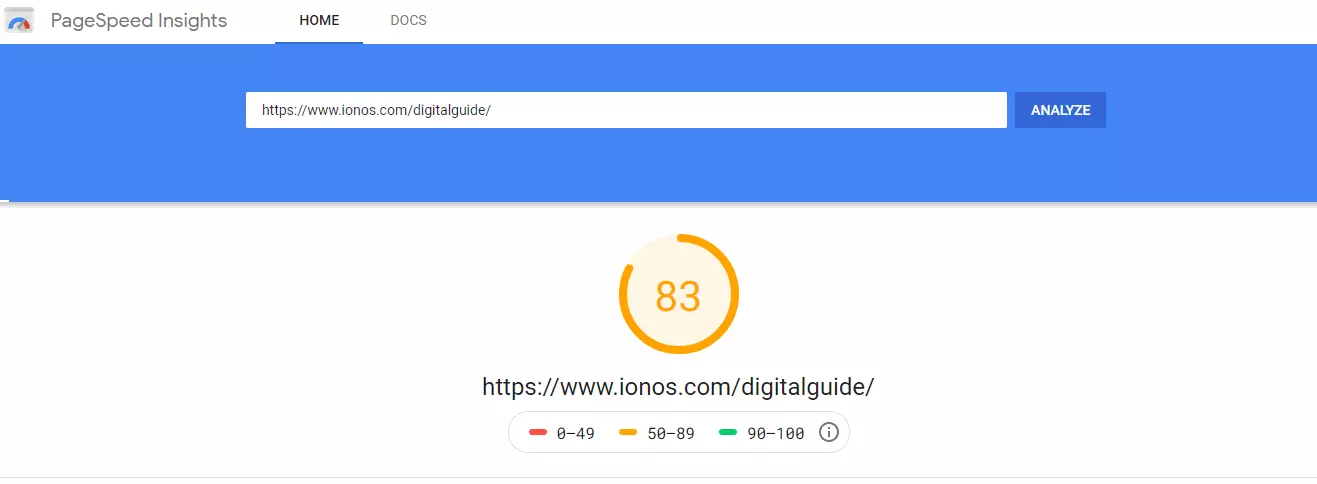
The result of the Google PageSpeed Insights analysis is displayed as a performance score on a scale of 0 to 100. This allows for an overall evaluation and helps get a quick general idea of the performance of a website. However, the results from PageSpeed Insights contain much more than just this score – they are broken down into a number of different indicators.
Performance score
At the top of the list is the performance score given on a scale from 0 to 100 and divided into three categories:
Field data and origin summary
Below this is the field data taken from the CrUX (data from the last 28 days), provided this is available for the given URL. If it is not available, you will get the message: “The Chrome User Experience Report does not have sufficient real-world speed data for this page.”
PageSpeed Insights still works without a Chrome User Experience Report!
If field data is available for the given website, the evaluation is based on the following scores:
- First Contentful Paint (FCP), which states how long it takes for the first image or text on the website to be fully rendered.
- First Input Delay (FID), which measures the time after which the user can first interact with the website.
- Largest Contentful Paint (LCP), which measures when the main content of a website is displayed on screen.
- Cumulative Layout Shift (CLS), which is an unexpected shift in elements on the page while the site is still loading.
These field data scores are once again categorized by speed:
Fast (green):
- FCP: between 0 and 1 second.
- FID: between 0 and 0.1 seconds.
- LCP: between 0 and 2.5 seconds.
- CLS: the cumulative layout shift is between 0 and 10%.
Average (orange):
- FCP: between 1 and 3 seconds.
- FID: between 0.1 and 0.3 seconds.
- LCP: between 2.5 and 4 seconds.
- CLS: the shift is between 10 and 25%.
Slow (red):
- FCP: more than 3 seconds.
- FID: more than 0.3 seconds.
- LCP: more than 4 seconds.
- CLS: the shift is more than 25%.
The four data types, i.e., FCP, FID, LCP and CLS, can also be shown as the “origin summary”. This means that they are shown for the whole domain. If there isn’t enough or if there is no field data for a specific URL, only the origin summary data will be shown.
Lab data (laboratory data)
Google PageSpeed Insights gets its lab data from Lighthouse, which is an open-source tool. This tool determines how good the website’s performance is by crawling the URL.
Here, we once again find the categories of “fast”, “average”, and “slow”, as well as the FCP, LCP, and CLS factors. However, these values have different ranges in the lab data. Two further values are also provided here: Time to Interactive (TTI), which is the total time it takes for a page to become interactive, after its Total Blocking Time (TBT), the total time during which it was unresponsive.
The sixth metric given in the lab data is the Speed Index. The speed index measures how quickly the content is displayed visually as the website loads. Lighthouse first takes a video of the page as it loads in the browser and then evaluates the visible progression between the frames.
The evaluation benchmarks used for the lab data are as follows:
Fast (green):
- FCP: between 0 and 2 seconds.
- LCP: between 0 and 2 seconds.
- CLS: the shift is between 0 and 10%.
- TTI: between 0 and 3.8 seconds.
- TBT: between 0 and 0.3 seconds.
- Speed index: between 0 and 4.3 seconds.
Average (orange):
- FCP: between 2 and 4 seconds.
- LCP: between 2 and 4 seconds.
- CLS: the shift is between 10 and 25%.
- TTI: between 3.9 and 7.3 seconds.
- TBT: between 0.3 and 0.6 seconds.
- Speed index: between 4.4 and 5.8 seconds.
Slow (red):
- FCP: more than 4 seconds.
- LCP: more than 4 seconds.
- CLS: the shift is more than 25%.
- TTI: more than 7.3 seconds.
- TBT: more than 0.6 seconds.
- Speed index: more than 5.8 seconds.
One of Lighthouse’s practical features is how it displays screenshots including time data, particularly when analyzing the cumulative layout shift (CLS), to show how the page loads in.
Recommendations and opportunities
In its second-to-last point, Google PageSpeed Insights gives recommendations, or “opportunities”, as to how you can optimize your website. Of course, the emphasis here is on how to reduce the loading times.
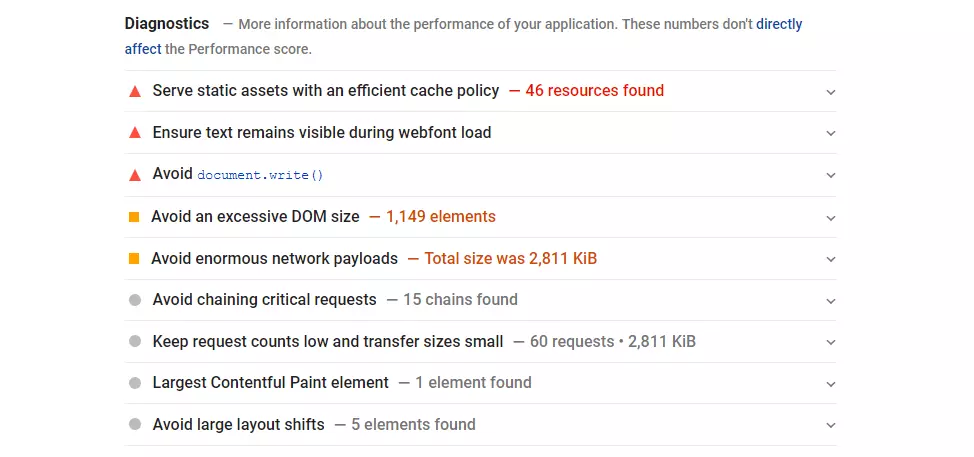
Diagnostics
This section generally doesn’t have any influence on the PageSpeed Insights scores, but it does give additional information about possible problems or the best solutions to optimize your website.
Just what is “fast” for Google PageSpeed Insights?
Website loading times have been an important factor in search engine optimization for years. SEOs are constantly referring to the importance of loading times in rankings. However, the performance of a website isn’t reflected only in short loading times, but also in a low response time, page size, and download speed. Google includes all of this in its evaluation of a page.
PageSpeed Insights shows only some of the many factors that Google uses to evaluate websites and rank search results. For a complete insight into the potential of a URL in search engines, IONOS offers a free SEO checker that is just as easy to use as Google PageSpeed Insights.
The speed of a website is relative. Generally, however, a loading time of 1.5 to 3 seconds is currently seen as average – anything above this is slow, and anything less than this is fast and to be recommended. These scores change over time with technological progress – in 2016, the average page loading time was over 3 seconds.
PageSpeed Insights and mobile-first indexing
All that said, the listed speeds by themselves are not enough for Google PageSpeed Insights to evaluate a page as fast. It doesn’t depend on every millisecond, but rather on the whole user experience with the selected website. This is particularly true for mobile versions, for which Google calculates their ranking and performance separately.
The desktop version of a website can be evaluated as fast, but that doesn’t necessarily mean that the mobile version will be too. As an increasing number of users tend to browse more frequently with their smartphones, the role of mobile sites absolutely cannot be neglected. The following measures are particularly helpful to make sure your website also performs well in its mobile version:
- Delete unused JavaScript to reduce the amount of data transferred via mobile networks.
- Use images in modern formats. Image formats such as JPEG 2000, JPEG XR and WebP often compress better than PNG or JPEG, which leads to quicker downloads and less data use.
- Use images in suitable sizes, to save mobile data and improve loading times.
- Remove resources that block rendering. Important JavaScript and CSS should be written inline and all non‑essential scripts and styles indented.
- Remove unused CSS code to avoid unnecessary mobile data usage.
- Code your images efficiently. Optimized images load more quickly and use fewer mobile data.
- Make sure that the text remains visible while the web font is loading by using the font-display CSS function. This means that the text can be read by users while the web fonts are loading.
- Minimize the effects of third-party code. Third-party code can significantly impact your loading times.
- Prepare static content with an efficient cache feature. Prolonged cache storage time can speed up websites for repeat visitors.
- Remove images that are not visible.
- Compress JavaScript.
- Activate text compression.
- Create pre-connections to necessary sources.
- Avoid unnecessary extensions on the page.
The mobile results from Google PageSpeed Insights should be just as important for ranking as the results for the desktop site. However, precisely how that factors into the argument hasn’t been revealed by Google. Nevertheless, as page speed significantly affects user experience, we presume that this factor is also highly relevant to the ranking. That said, as the relevance and quality of the content also affect the ranking, you can still get high rankings even with an average page speed. Ideally, your page should be well built in terms of both its content and its technical structure.
Google PageSpeed Insights: Three highly optimizable factors
Google PageSpeed Insights is what it says on the tin: an insight into the performance, current problems and possible solutions for a specific URL or whole domain. The three factors that always play a decisive role in this aspect will be explained in the following sections.
Image optimization
Images are often the most resource-heavy part of a website. They’re generally too big, are in the wrong format and are poorly named. Google punishes this, but so does any visitor to the website who impatiently closes it if the images still haven’t fully loaded after several seconds.
Most images are uploaded in JPEG or PNG format. However, for a website, JPEG 2000, JPEG XR and WebP formats are much more suitable, as they can be more easily compressed without any visible deterioration in quality. For example, an image with a file size of 440.7 kilobytes (KB) as a .jpg is only 135.1 KB as a JPEG 2000. When this is added up, especially on a website with many images, this can make a palpable difference.
In today’s world of HD images, it’s incredibly important to compress every single image before loading them onto a website. Images with a file size of several megabytes have no place being on a website. Image editing programs such as Photoshop offer features like “Save for Web”, where the image in question is saved in a lighter format that is optimized for web display.
For your website’s SEO ranking, it is also to your advantage to give all images a file name that matches your site’s theme. This way, you can also score points with image SEO.
A good cache
Sometimes, it is the smallest things that make the biggest difference. Browser caching lightens the data transfer load from the server to the user, resulting in faster pages. To avoid having to reload all files from a website upon each new visit, the browser can instead access files that were saved in the meantime.
However, to fully optimize the cache, the browser must know how long it should save the files for. Files from a website must therefore have an expiration date. As an example, dynamic HTML code, which is constantly changing, must generally be saved more frequently than images.
The best way to adjust your browser caching is by using the “mod_expires” module, if your website is hosted on an Apache server. You can check whether the module is active by using the “IfModule” command. Using “ExpiresByType”, you can get information about individual data types. You can then define the expiration date by typing “Access plus 7 days”, which sets the minimum save duration of the browser to seven days. They will not be downloaded again until after this time has elapsed. You can individually adjust the period and even vary it for different data types. However, one week is the recommended time period.
You can activate your cache, and do other things, by using the following code in the .htaccess file:
<ifmodule mod_expires.c></ifmodule>
ExpiresActive On
ExpiresByType image/gif "access plus 7 days"
ExpiresByType image/ico "access plus 7 days"
ExpiresByType image/jpeg "access plus 7 days"
ExpiresByType image/jpg "access plus 7 days"
ExpiresByType image/png "access plus 7 days"
ExpiresByType text/css "access plus 7 days"
ExpiresByType text/javascript "access plus 7 days"
ExpiresByType application/x-javascript "access plus 7 days"
ExpiresByType application/javascript "access plus 7 days"
The average loading time of a website (provided the visitor accesses it multiple times) can be significantly improved using this setting. For fine adjustments, checking back on Google PageSpeed Insights is always useful to determine the optimal load time for all data types.
Bringing the server to the forefront
There’s a lot to take note of and to improve for this. Most websites are on shared hosting platforms with limited resources. This can slow the access to and loading times of each individual website. This problem can be fixed by acquiring more performance (CPU, RAM, etc.) or by moving the website to a dedicated server. However, the corresponding hardware setting for the website must be built in this case. A suitable hosting server can significantly improve the website’s performance. To find out more and to get a direct comparison, you can read our article on “Shared Hosting vs. Dedicated Hosting”.


