

Fishbone diagram: Solving problems properly

Every company faces its own problems. Often managing directors and employees are forced to deal with new challenges every day. But how wise is it having to overcome the same obstacles every day? Instead of dealing with the symptoms, the root of the problem must be addressed. But finding the cause of a problem is not an easy task. The fishbone diagram assists in identifying the cause of a problem.
What is the fishbone diagram?
The fishbone diagram, invented by Ishikawa Kaoru, a Japanese chemist, (hence why it is also referred to as the Ishikawa diagram) aims to help companies find solutions to problems and their causes in a structured way. It is therefore also called the cause-effect diagram. Every problem, requiring a sustainable solution, is graphically illustrated with its respective causes in the diagram.
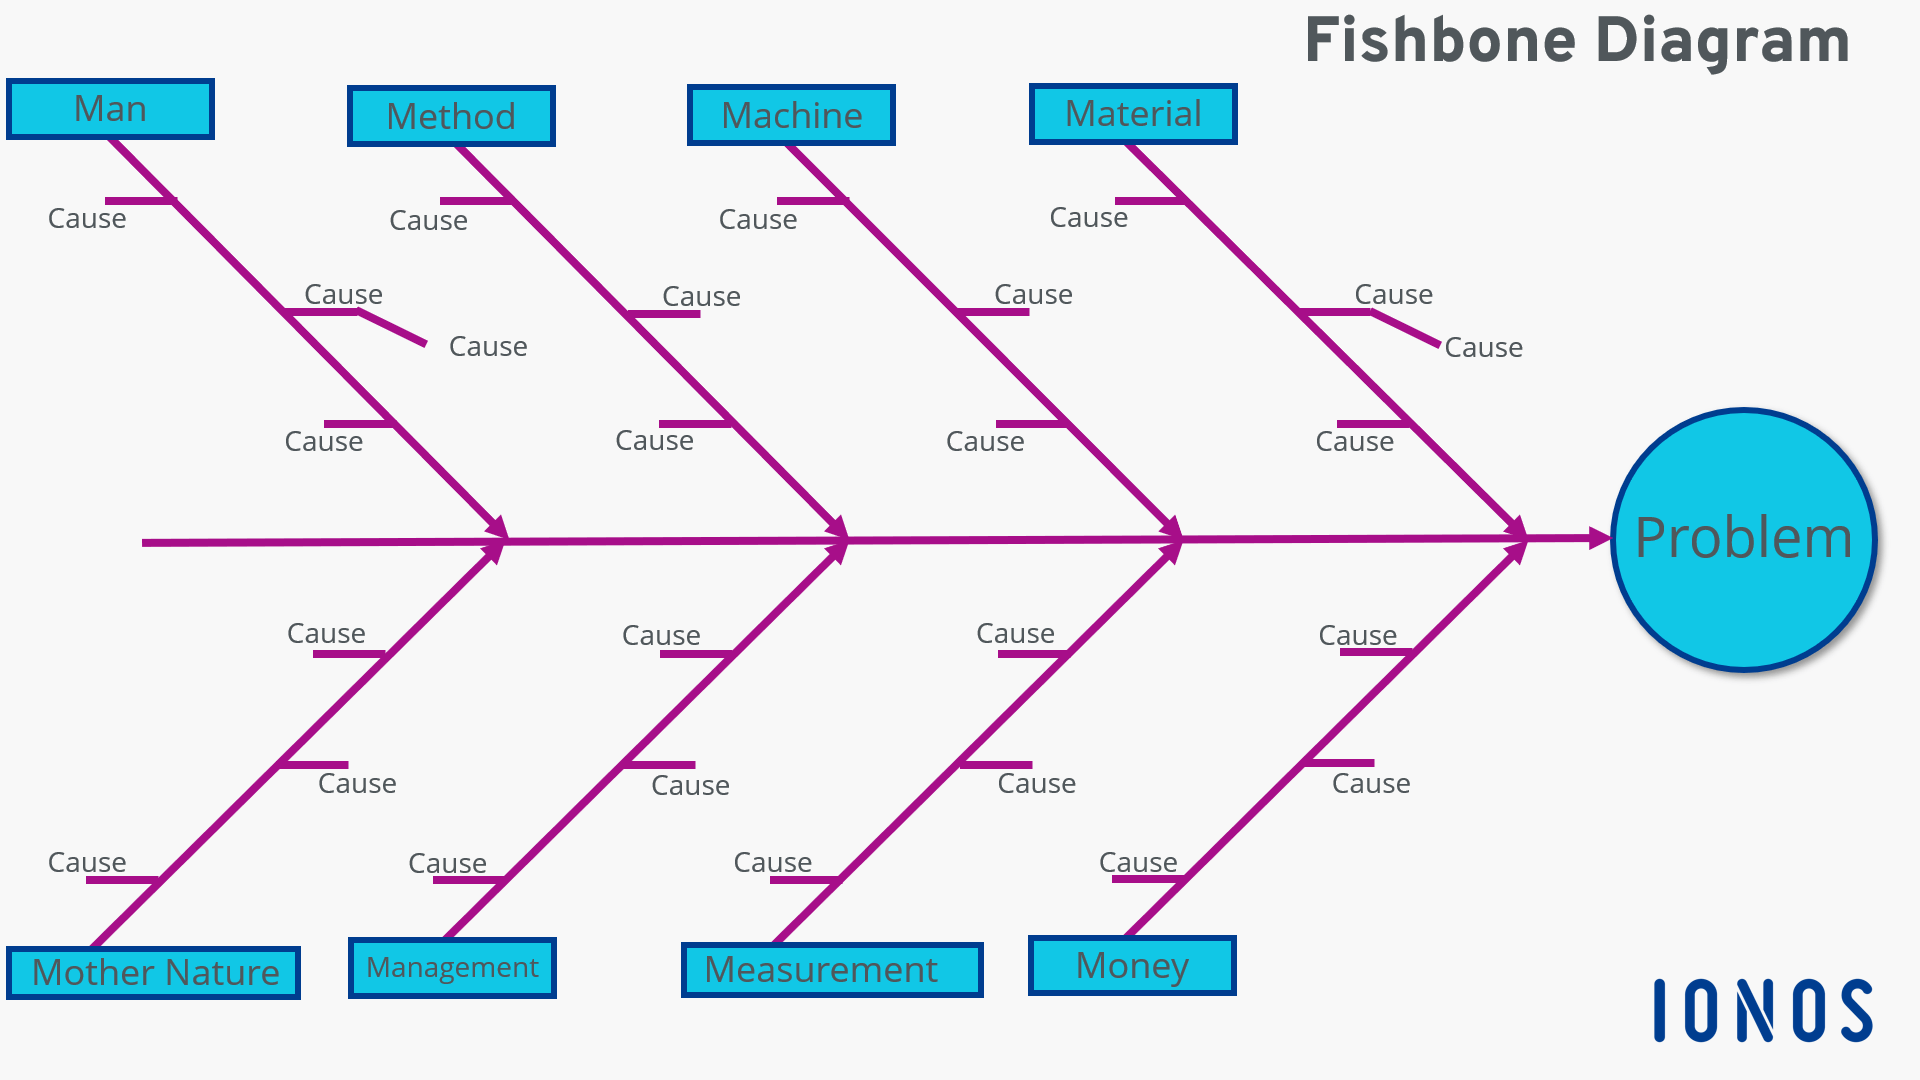
The problem that needs to be addressed is on the right side of the diagram. It is written down before any other observations are made. Be as accurate as possible when describing the problem and write it on the right hand side of the flip chart or blackboard. You then draw a line or an arrow to the left i.e. pointing towards the problem. Several other lines branch off from this main line: the possible causes of the problem. When specifying the potential causes of the problem, you can use several methods: the 4M method, and its extensions the 5M and 8M methods, are frequently used. They refer to the main influencing factors of processes, which often lead to problems.
The 4M method uses the following main influencing factors:
- Material
- Machine
- Method
- Man
The 5M method also uses the additional factor of:
- Mother Nature
When using the 8M method, three additional factors are used:
- Management
- Measurement
- Money
It is not always mandatory to use 4, 5 or 8 factors for the fishbone diagram. Instead, all relevant factors for the problem should be addressed. And you can of course use other terms that do not begin with M.
The lines branching off from the main line list the actual causes of the problem and are arranged according to the appropriate categories. These causes should be identified very explicitly as opposed to the rather broadly defined main influencing factors.
This graph resembles a fish skeleton, which is why the Ishikawa diagram is also known as the fishbone diagram.
Cause-effect diagrams in practice
As an example of how this diagram can be applied in practice, imagine a company with insufficient customer support. This company receives repeated complaints that the hotline does not offer any help.
Step 1: Stating the problem
As a first step, the problem must be stated precisely: “Insufficient support” is not a good enough statement for our example. The more detailed the problem is explained, the more effective the fishbone diagram can be. The problem is written to the right of the arrow.
Step 2: Defining the main influencing factors
Now the possible categories of causes, which lead to this problem, must be defined. In our example we use all the terms of the 8M method.
- Material: Type of customer queries
- Machine: Technical equipment of the support team
- Method: Workflows of the support team
- Man: Staffing of the support team
- Mother Nature: Type of customer
- Management: Support by the management
- Measurement: Key figures of the support team
- Money: Budget of the support team
These basic factors are now added to the fishbone diagram. Lines branch off from the main line to these terms.
Step 3: Stating the causes
Next to the category lines, the specific causes of the problem can be added. It is recommended to complete the fishbone diagram as a team. In particular, it should be done with those employees, who are directly involved in the problem-causing processes. The team should be mixed since if people with different expertise are involved, there’s more chance it will lead to extraordinary ideas. Brainstorming is required in order to find the causes. As a group all potential causes are to be identified.
For example, under “Material” it would be a good idea to comment on the type of customer inquiry. Also “Lack of knowledge on the customer’s part” as well as “Rudeness of the customer” could be added.
When analyzing the problem, further subcategories can be elaborated upon. With such a level of detail, the causes of the problem can then be determined. For example, the rudeness of the customers could be explained by excessively long waiting times on the hotline.
In order to find the real cause of a problem, the 5W method is used. Here the “why” question is asked five times in order to get to the root of the problem.
A solution to the problem requires time. Rushing the process is counter-productive. If a cause is overlooked, the whole project might be in peril. If you try to find the causes of a problem too quickly, you’ll be in danger of discovering only some of the causes but overlooking the most important ones.
Step 4: Setting priorities
In the best-case scenario, you’ll be able to see the causes of a specific problem emerging after creating a fishbone diagram. But it is not effective if you tackle all issues simultaneously. If you spend your energy and resources in this manner, there is a risk of investing a lot of time and effort in solving a problem, without remedying any cause. It is important to concentrate on only one cause of the problem - namely the most important one!
Priorities can also be set as a team. Each employee state their opinion as to what is the most serious cause of the problem. Continuing using the diagram, each person can evaluate the seriousness of the causes by giving points. The cause with the most points will then be the top priority. Before the vote, it is important to discuss the problem so that everybody has the same level of knowledge on it and does not rely on their gut feeling.
Not all issues listed in the fishbone diagram need to be actual causes. Suspicions may also be added to the diagram. When choosing the possible cause to be addressed first, it is therefore also important to consider probabilities (“How likely is it that the problem is being caused by…?”).
Step 5: Taking measures
The last step is to tackle the problem by eradicating the cause or causes. However, it is first necessary to check whether the correct cause has been identified at all. This can be verified with a significance test, so that suitable methods can be identified to solve the problems.
The cause-effect diagram is only one of many tools for optimizing work processes. In order to obtain the highest possible efficiency, however, it also is recommended to know the Pareto principle, according to which 80 percent of the results can be achieved with 20 percent of the total effort.
Advantages and disadvantages of the fishbone method
The cause-effect diagram provides a creative approach to problem-solving within an organization. The graphic illustration and the joint development of the diagram often lead to new insights, even when things seem to stall. But it is important to remember that the fishbone diagram simplifies things a lot. Often the complexity of business processes is ignored. Thus, neither temporal causalities nor mutual correlations may be represented.
In addition, there is a risk of creating chaos if the complexity of the problem is illustrated comprehensively in a diagram. The aim of the fishbone method is to create order in order to solve a problem. By classifying into categories and subcategories, the problem becomes more tangible and can be solved more systematically. Despite the creativity needed, the method also requires a disciplined approach to reduce the relevant issues in order to remain effective.
| Advantages | Disadvantages |
|---|---|
| ✓ Encourages creativity when searching for the causes of a problem | ✗ Requires discipline and simplicity in order to render the diagram useful |
| ✓ Categorizes possible causes | ✗ Predefined categories (e.g. 5M) can limit creative problem-solving avenues |
| ✓ Working in a team opens up new perspectives | ✗ Complex correlations cannot be illustrated in the fishbone diagram |
| ✓ Causalities of causes are illustrated | ✗ Does not provide solutions, but only illustrates the causes |
| ✓ Encourages employees to contribute ideas | |
| ✓ Simplifies the problem | |
| ✓ Easy to use and easy to learn |
Click here for important legal disclaimers.